


4 Ways the Export-to-Excel Workflow Destroys Operational Accuracy
The moment your team downloads a CSV, the data is operationally dead — inventory levels, capacity counts, and cost figures no longer match the system of record. Every decision made in that spreadsheet is a decision made on yesterday's numbers.

Your CSV aged 4 hours on download

Copilot sees text - not your BOM

Manual re-entry: 500 rows, one error

One broken VLOOKUP, zero visibility


Grid Power Features
Grid Capabilities That Replace Manual Data Manipulation
Every data table across the entire workspace is built on a high-performance interactive grid. These four capabilities give power users direct operational control over live data - no export, no IT ticket, no specialist required.
Interactive Tables With Persistent Column Memory
Drag, resize, reorder, and filter any column directly on screen - the system memorizes your exact layout preferences per user profile for every future session. Legacy grids that reset overnight waste an estimated 5 minutes per analyst per login just rearranging columns.
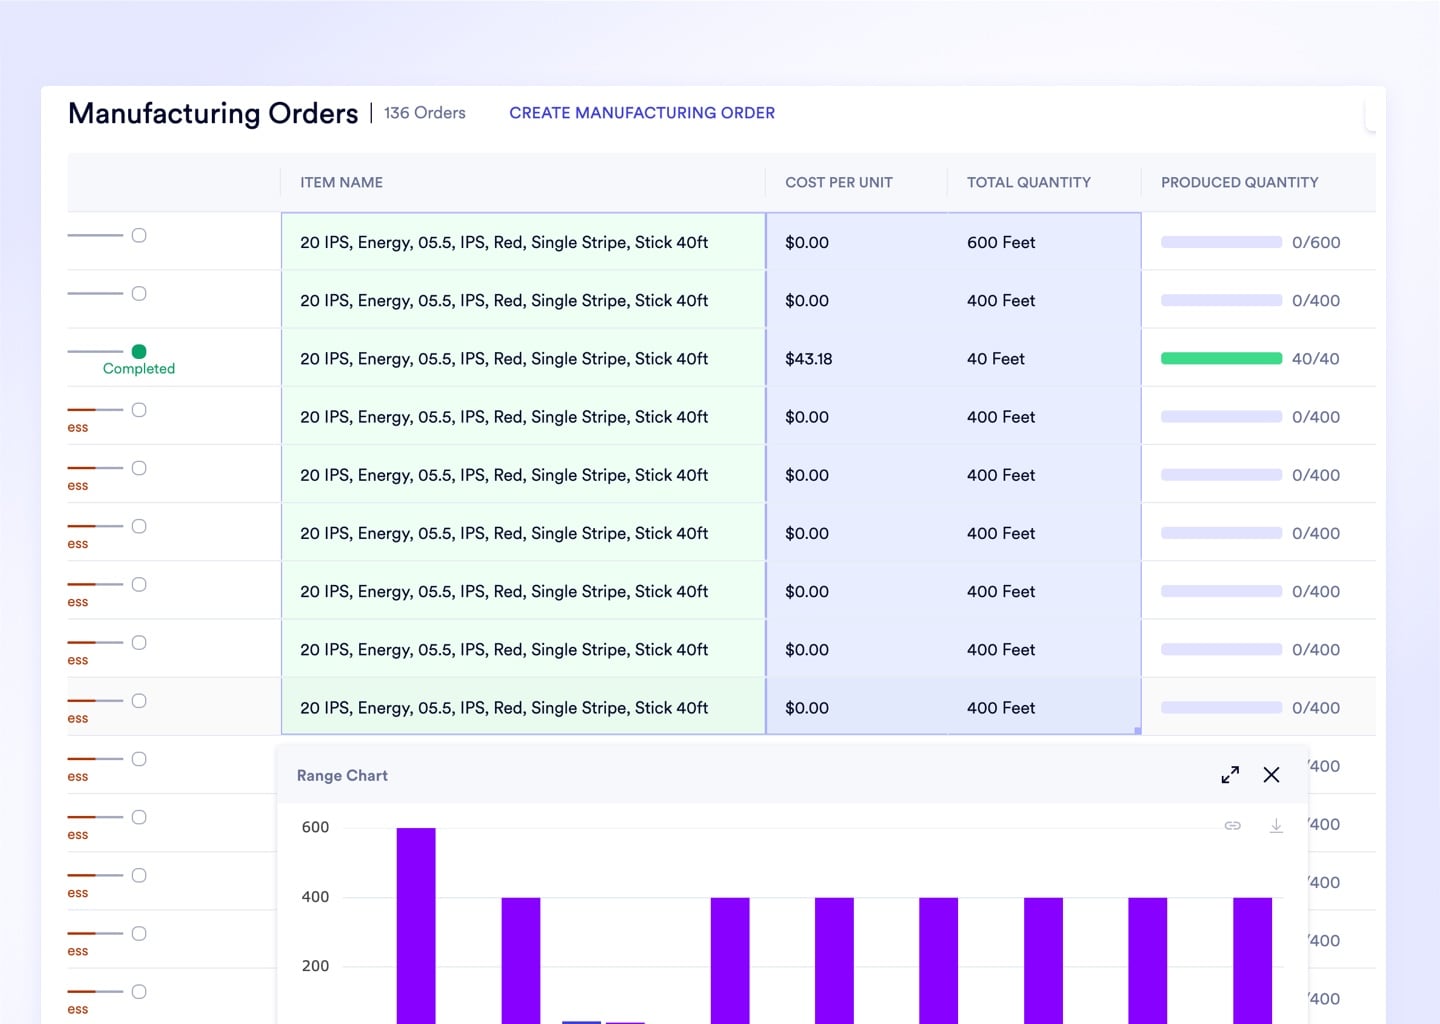
Dynamic Visualizations From Highlighted Cell Selections
Highlight any set of cells and the footer instantly computes the sum, count, and average of your selection. Right-click to render a bar or pie chart from exactly the data you have highlighted - zero chart-builder configuration required.
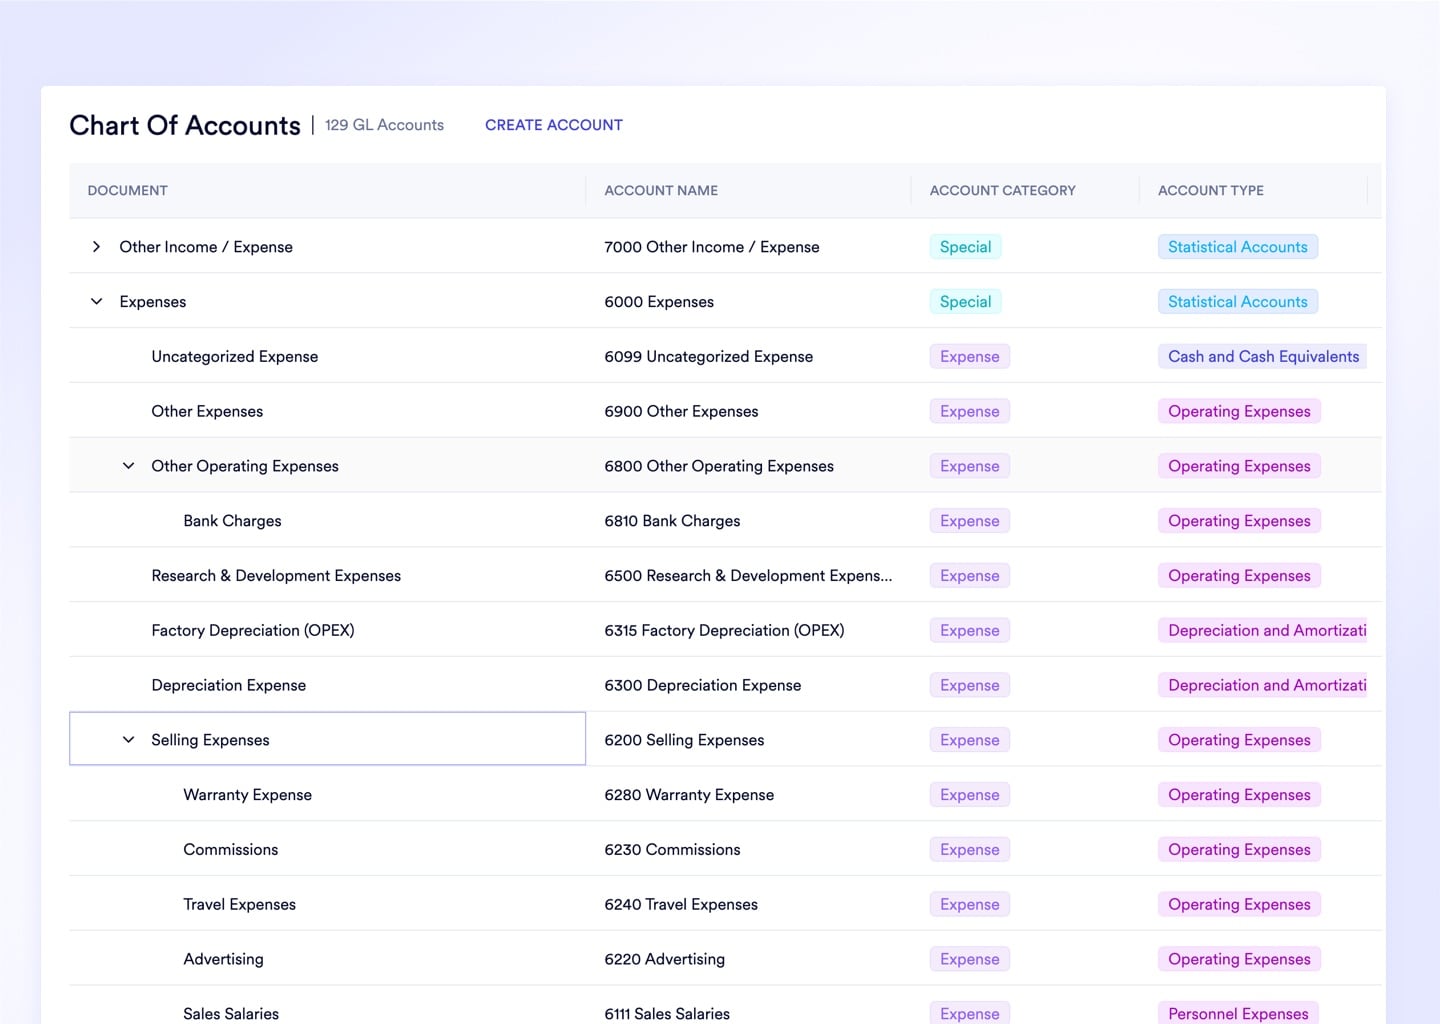
Row Groups Collapse 10,000 Orders Into Readable Category Totals
Drag any column header into the Group By zone to instantly collapse a flat list into hierarchical category buckets with aggregated totals. Group all sales orders by customer or all inventory by status in under 3 seconds.
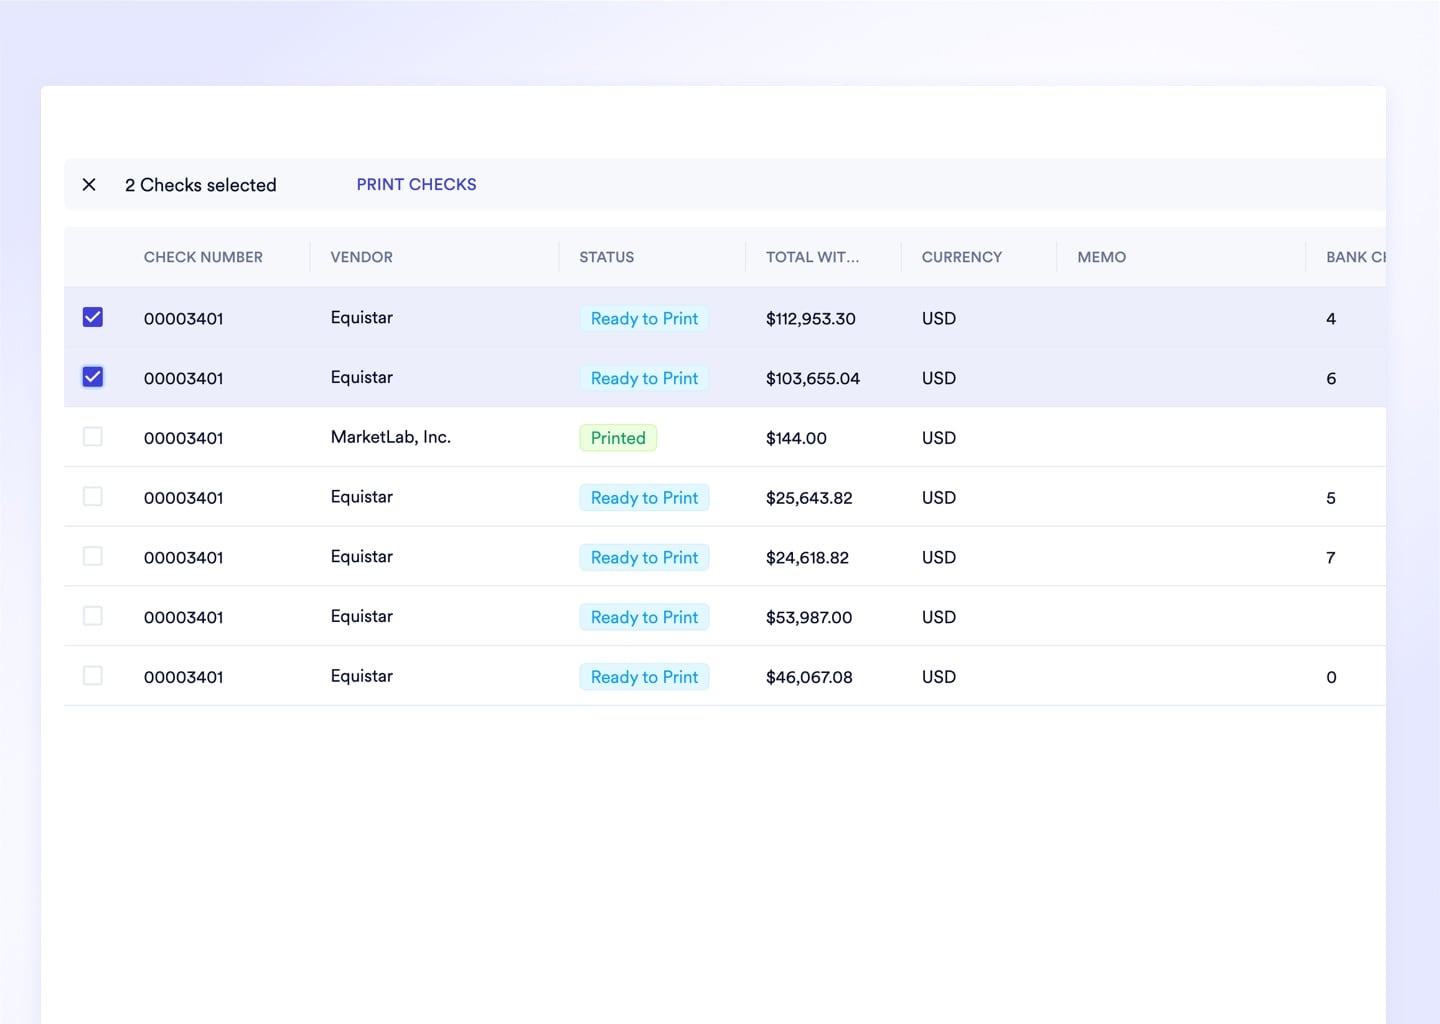
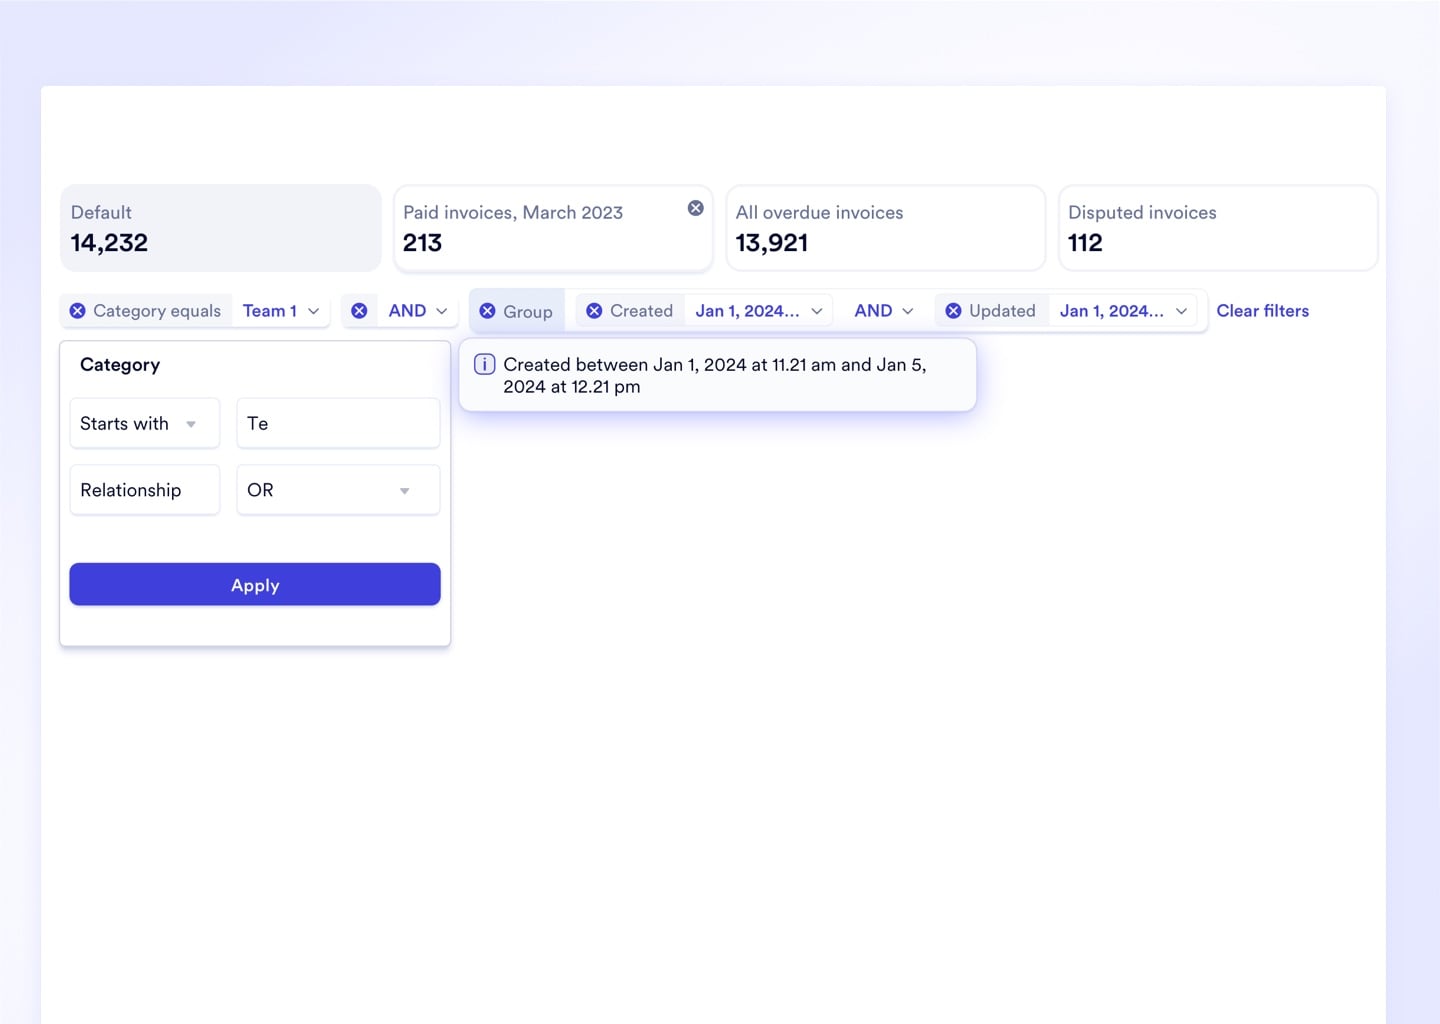
Advanced Filtering Chains AND/OR Conditions Across Multiple Columns
Build multi-condition queries like "All open POs over $10k AND past due AND from Vendor X" directly in the filter panel - no SQL, no IT ticket. Precise data isolation runs instantly across millions of rows.
Every Grid and Reporting Capability Included - No Extra BI Seat License


Hundreds of Visualization Types. 0 SQL Required. 1 Database.
Every capability below is built natively into the Naologic workspace - no third-party BI subscription, no data warehouse setup, no IT configuration. Your data, your queries, your live system of record.
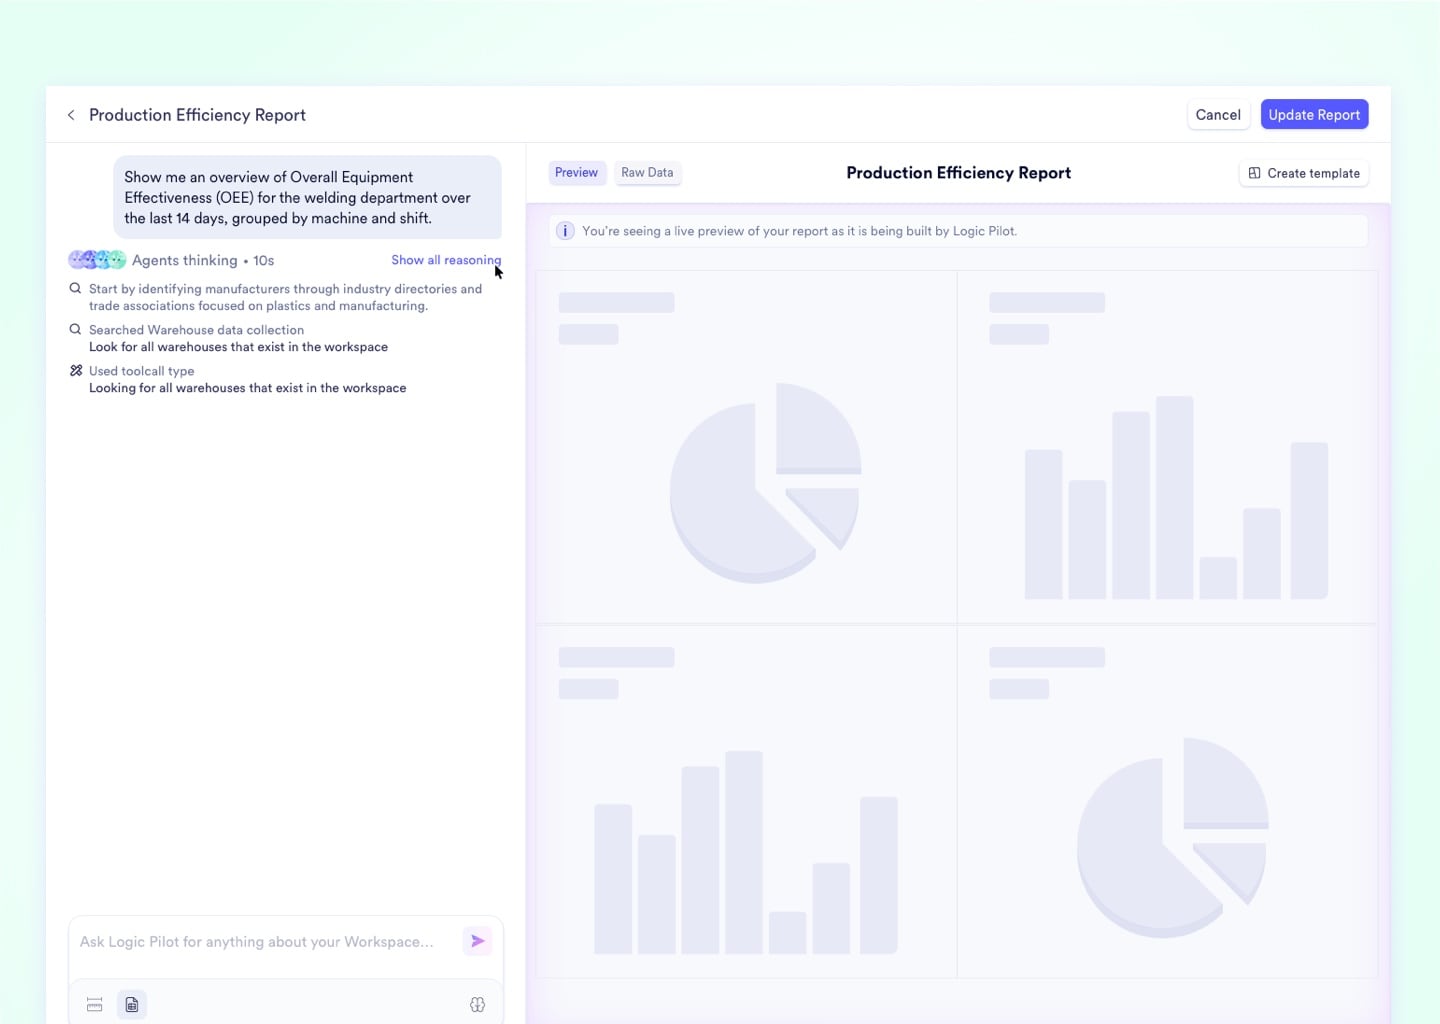
In 30 minutes, we will show a Production Planner querying real-time capacity data, building a pivot scenario with natural language, and writing the schedule update back to the live database - without leaving the screen.
Replace Tableau, Power BI, and Excel Reporting
Naologic's native reporting module replaces standalone BI tools - with AI query capability, 100+ visualization types, and live dashboards included at no extra seat cost.
See all reporting featuresFree Migration From GlobalShop, JobBOSS, or NetSuite
Move off your legacy ERP with a dedicated extraction toolkit. White-glove migration services are fully included - no consulting fees, no separate engagement.
See migration options