


Your factory runs faster than your reports
When plant managers wait days for formatted data, floor decisions happen on gut instinct rather than real numbers. Exporting CSVs, formatting pivot tables, and mailing static PDFs creates a systemic lag between operational reality and leadership visibility. Naologic eliminates the delay by connecting raw floor telemetry directly to live, self-serve dashboards every manager can build and query without IT. The result is a leadership team that acts on this week's scrap rate - not last week's spreadsheet.


Self-serve analytics
Any user builds a live dashboard in under 5 minutes
Naologic replaces your BI tool stack with a single, AI-powered analytics engine that every manager, analyst, and plant director can use immediately. No training required, no developer ticket to file, no third-party integration to configure or maintain. The data is already in the system - the interface finally gets out of the way.
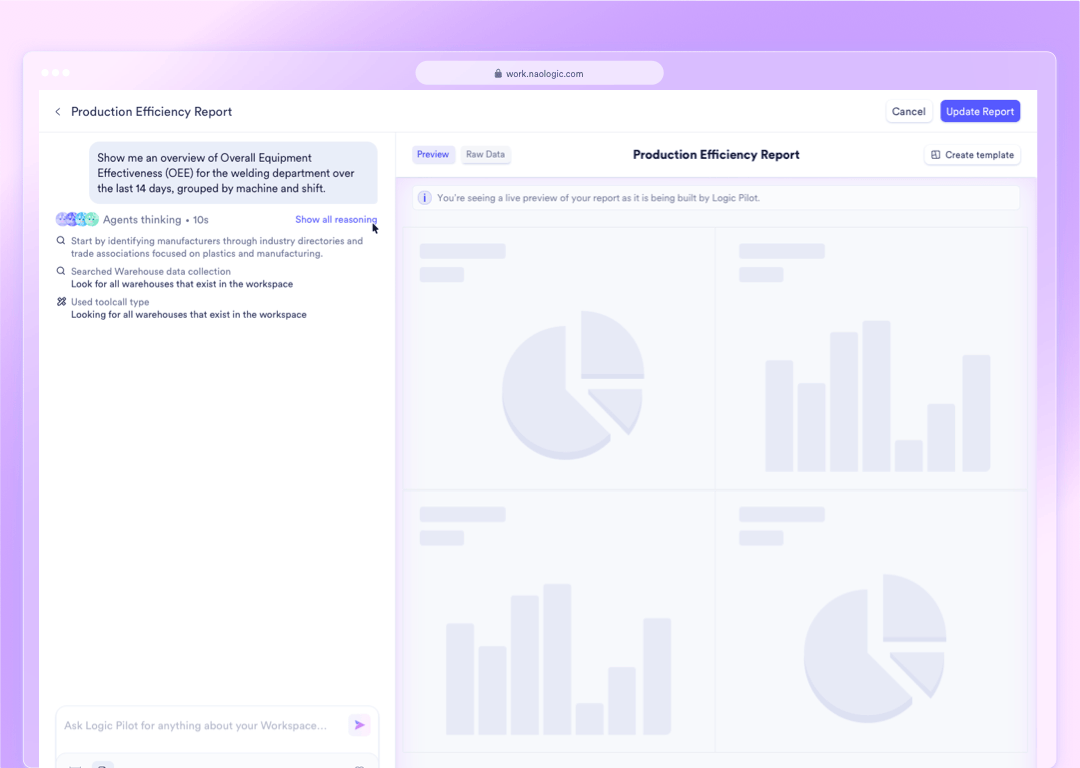
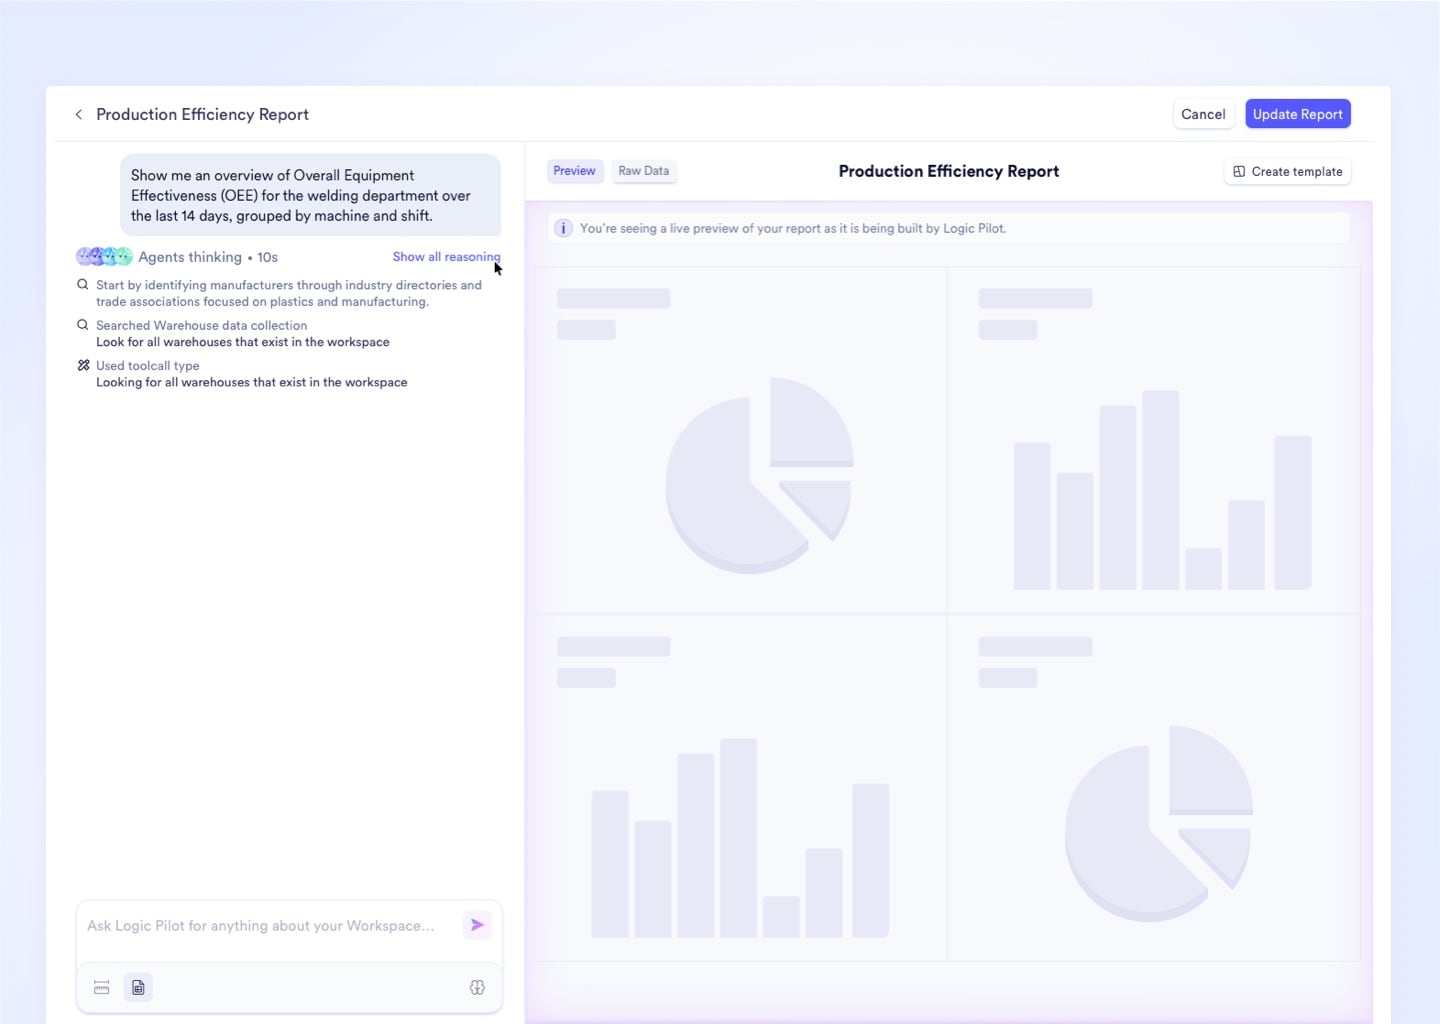
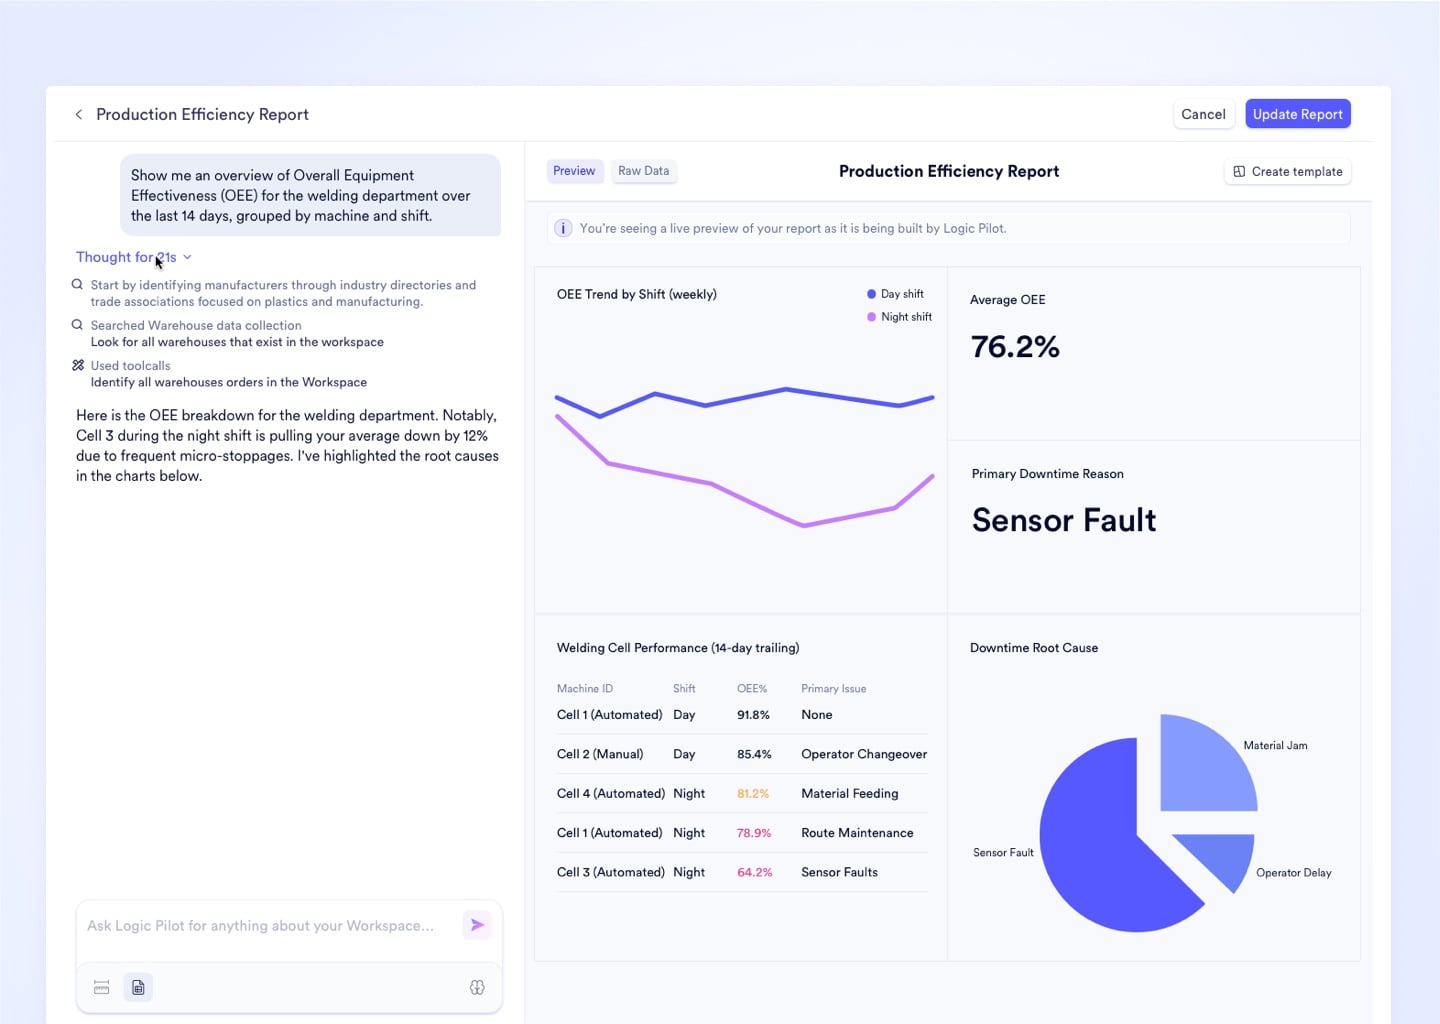
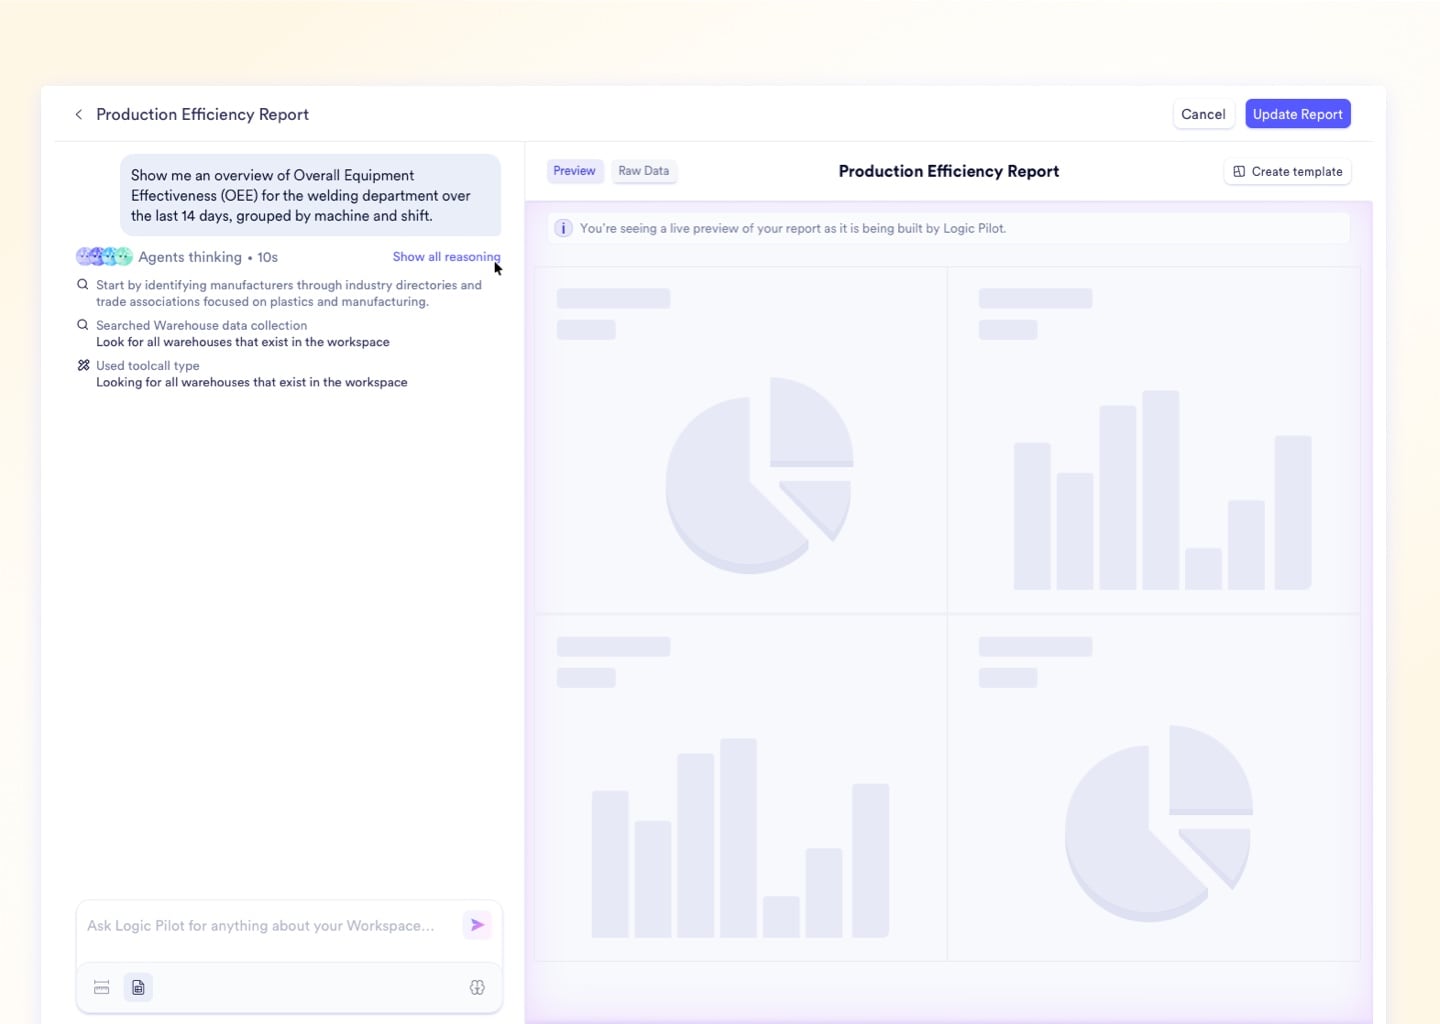
Natural Language Report Builder
Type a plain-English question - "Top 5 materials by scrap cost last quarter?" - and Naologic instantly builds the exact visualization, queryable against your full data lake with zero SQL required.
Over 100 Visualization Types
Standard bar charts cannot convey machine utilization patterns. Access heat maps, scatter plots, Sankey diagrams, and radar charts to represent your exact manufacturing metrics accurately.
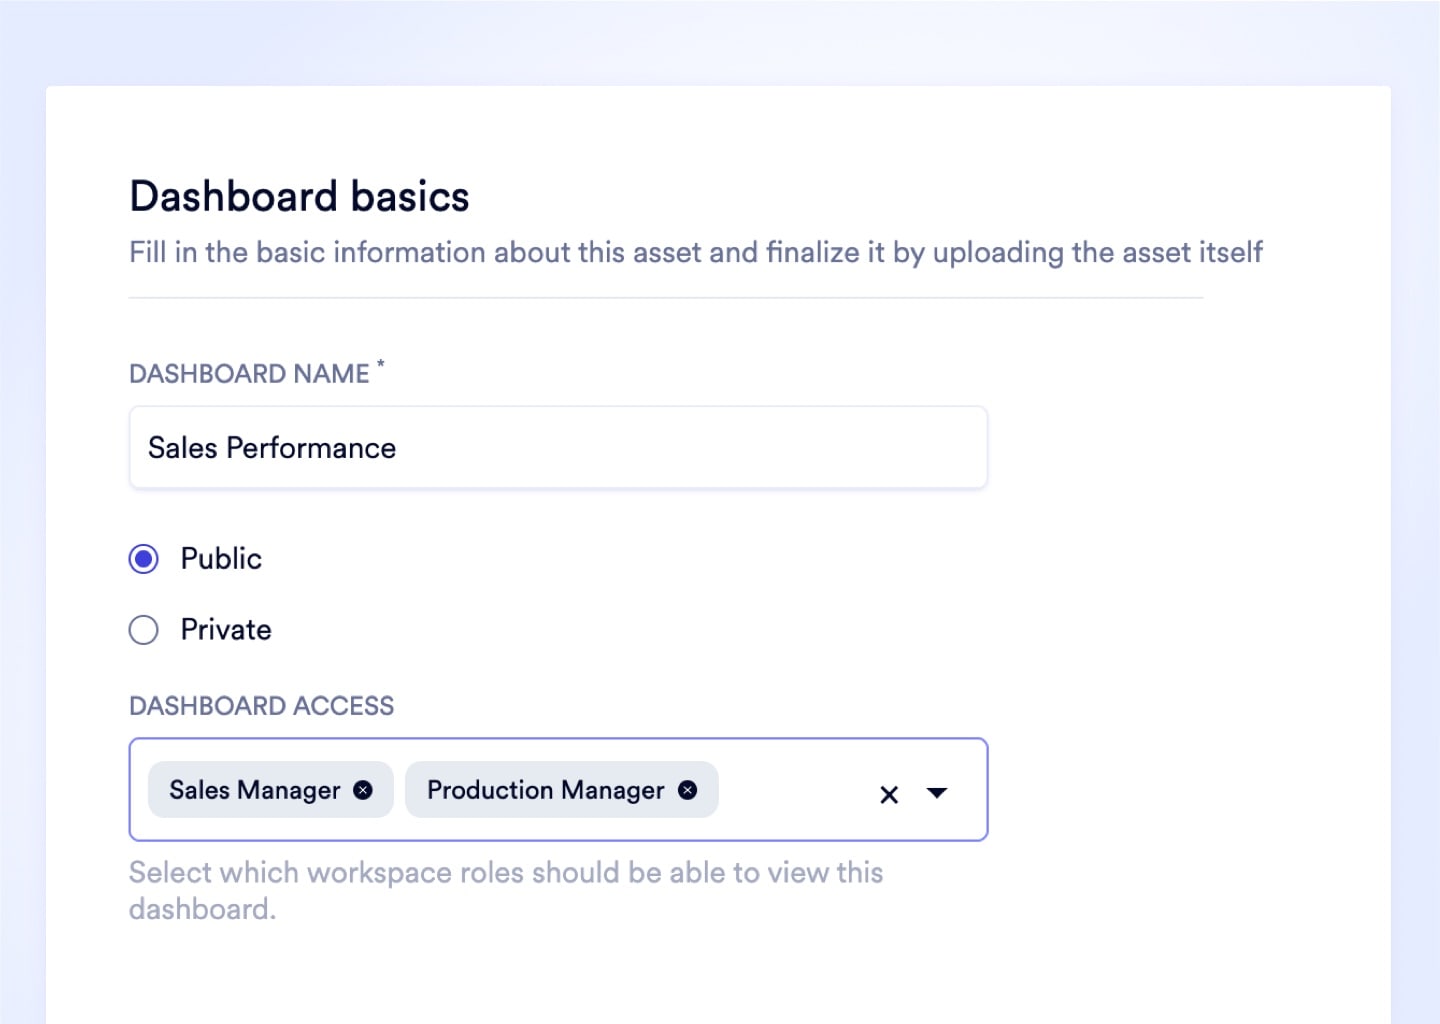
Private and Public Dashboards
Sensitive margin data stays in a Private Dashboard for exec eyes only. Floor KPIs publish to a Public Dashboard by role - every work center sees exactly what it needs to hit targets.
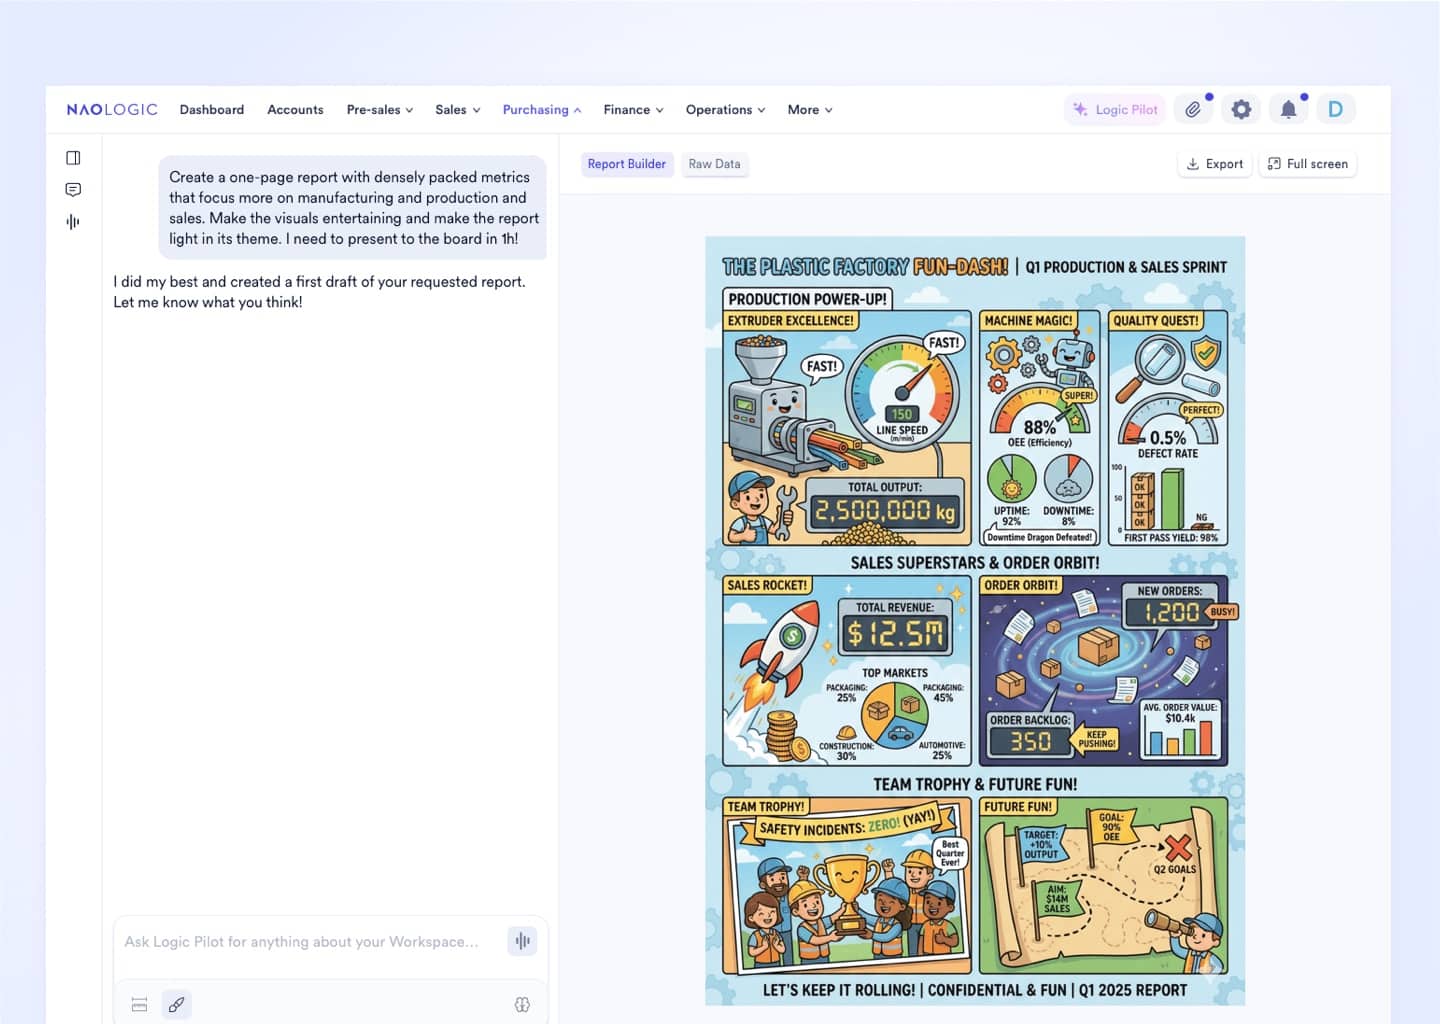
Visual Report Mode
Switch to Visual Report mode before your next board meeting. The AI reformats dense workspace data into board-ready graphics - no PowerPoint session, no analyst hours burned.
Democratize your entire data lake
Naologic's Natural Language Report Builder gives every manager in your operation direct access to every data point in the system - from pending purchase orders to finished goods yield rates. Ask a question in plain English. The AI crunches the query against millions of rows and returns the exact visualization you need in seconds. Pin it to a live dashboard, schedule a Monday morning delivery to the leadership team, or export it for the board deck. Zero coding required. Zero IT dependency. No expensive SQL developer standing between your question and the answer.
Naologic reporting, by the numbers
From data-starved to data-driven - in days, not quarters
Manufacturers on Naologic replace static CSV exports and expensive third-party BI licenses with a single, native analytics engine that delivers leadership intelligence in real time. Every module feeds the same data lake - queryable by anyone, on demand, without developer support.
100+
Distinct visualization types available natively in the Report Builder - from standard line charts to geographic heat maps and Sankey diagrams
0 SQL
Lines of code required to build a fully custom, live-updating executive dashboard using the Natural Language Report Builder
1-click
Report regeneration with Custom Report Templates - rebuild any complex, multi-filter analysis instantly against the latest live data
Auto
Production reports generated for every completed Manufacturing Order - aggregating actual times, costs, and scrap with no manual operator input
Production reporting
Every closed MO generates a flawless production report - automatically
Every completed Manufacturing Order auto-generates an immutable Production Report aggregating actual up-hours, scrap rate, downtime categories, and shift attribution from raw Job Sheet data - no operator estimates, no manual compilation. Color-coded performance labels tag Over-Performing, Standard, and Underperforming runs instantly, so a floor director scrolling 500 historical reports spots the red entries without opening a single row.


Push intelligence to leadership before they ask for it
Naologic's AI does not wait to be queried. Program Custom AI reports and emails to automatically analyze the week's performance data and push a synthesized executive summary directly to the leadership team's inboxes or phones on a schedule you define - daily, weekly, or on any custom cadence. Set the AI prompt once: "Summarize last week's production performance and flag anomalies." Define the distribution list. Choose email or SMS. The digest arrives every Monday morning before the first meeting, formatted and specific, without anyone logging into a dashboard. Your CEO gets scrap rates, on-time delivery, and margin variance in one clean message - and the only thing left to do is make the call.


Manipulate your data directly - without exporting it
Interactive Tables Built for Power Users
Drag, resize, and reorder every column directly on-screen. Mobile and tablet native behavior with per-column filters available on every list view across the entire workspace.
- Column drag-and-drop reordering
- Per-column advanced filtering
- Mobile and tablet native behavior
- Resizable column widths
Native Pivot Tables - No Excel Required
Toggle Pivot Mode inside any data grid to instantly cross-tabulate massive datasets, aggregate category totals, and run multi-dimensional analysis without leaving the ERP.
- One-click Pivot Mode toggle
- Row groups for instant aggregation
- Drill-down without leaving ERP
- Advanced AND/OR filter logic
Columns That Remember Your Workflow
Intelligent columns persist your exact layout preferences - widths, ordering, hidden fields - so your workspace is configured exactly as you left it every morning.
- Persistent column configuration per user
- Table Column Nesting for dense data
- Instant right-click chart on selection
- Sum and average auto-calculation in footer
One-Click Exports and Pixel-Perfect PDFs
Export any filtered table as a CSV instantly, or generate professionally formatted PDFs for outbound documents - respecting all active column settings without browser formatting breaks.
- CSV export from any table in one click
- Native PDF rendering engine
- Respects active filters and hidden columns
- Print-ready invoices, POs, and production reports
Full feature breakdown
Every reporting capability in one platform - no BI tool required
From the Natural Language Report Builder and 100+ visualization types to automatic production report generation and ISO-compliant NCR workflows, Naologic's analytics layer covers every data surface in your manufacturing operation. No Tableau. No Power BI. No Friday afternoon exports.
Naologic vs. the tools your analysts are exhausted by
Most manufacturers patch reporting together from three disconnected sources - a rigid ERP, a third-party BI tool, and a graveyard of Excel files. Naologic's native analytics engine replaces all three from a single interface.
