Drag, Drop, and Reflow Your Entire Factory Schedule

Replace your whiteboard, spreadsheet macros, and frozen Gantt charts with one interactive timeline. Schedule hundreds of manufacturing orders across every work center - with setup, cleanup, and changeover time auto-calculated into every block.

Add an image or video
Logo 1
Logo 2
Logo 3
Logo 4
Scheduling performance

80% Fewer Manual Schedule Changes. 10,000 Orders Your Browser Won't Drop.

Production planners at mid-sized manufacturers juggle hundreds of active orders, dozens of machines, and constant disruptions. Naologic processes the math your spreadsheets refuse to handle.

10,000+
concurrent scheduled events rendered at 60fps on the interactive timeline
80%
reduction in manual rescheduling time using one-click Reflow optimization
100%
of non-productive time (setup, cleanup, changeovers) automatically calculated into every schedule
0
seconds of browser lag when panning and zooming across months of production data

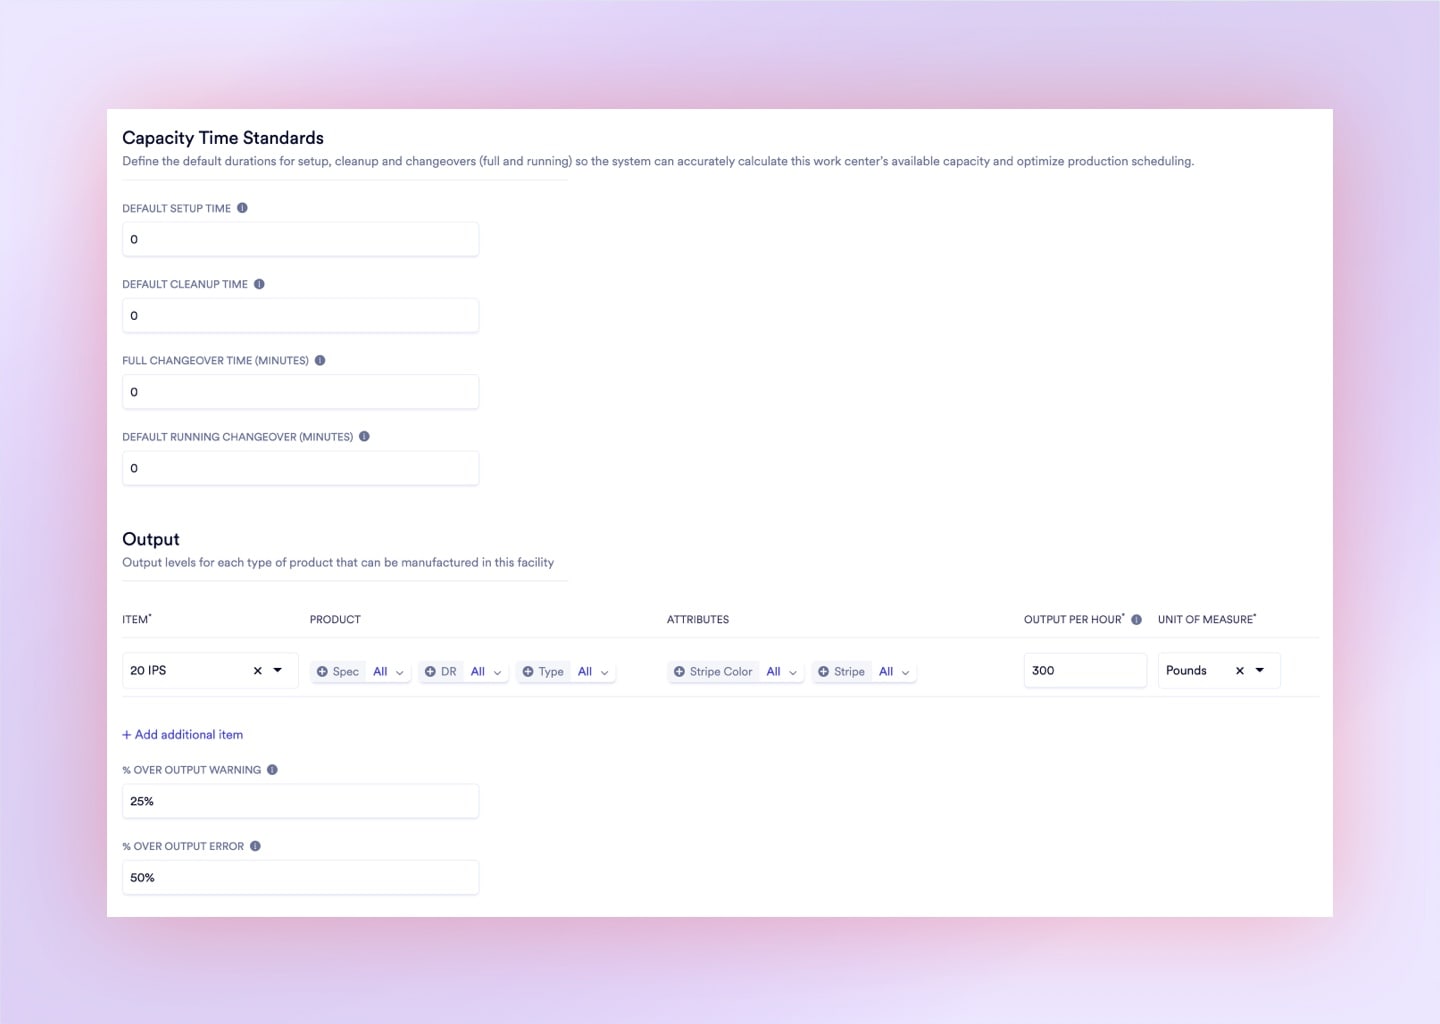
Setup, Changeovers, and Downtime Your ERP Ignores

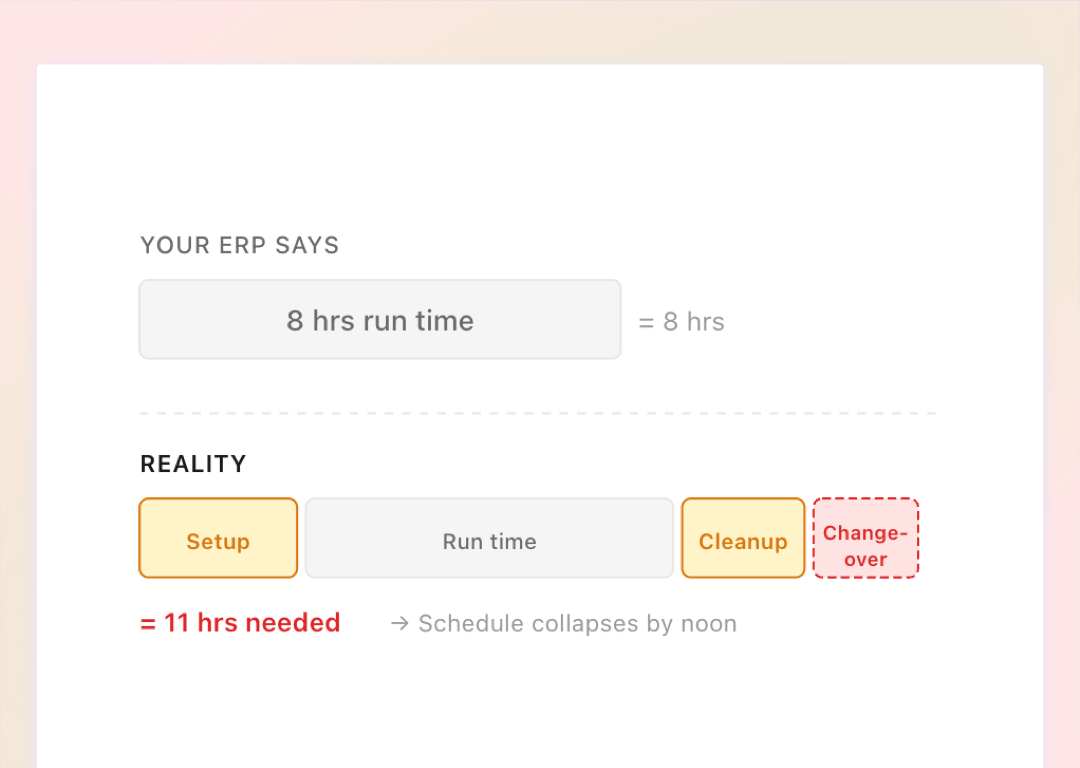
Your current scheduler calculates pure run time. It has no model for the hidden hours that destroy your plan before the day has even started.

Fictional Run-Time Math

Legacy ERPs skip setup durations, cleanup windows, and tooling changeovers. Your 8-hour plan needs 11 hours of real machine capacity.

Upload media

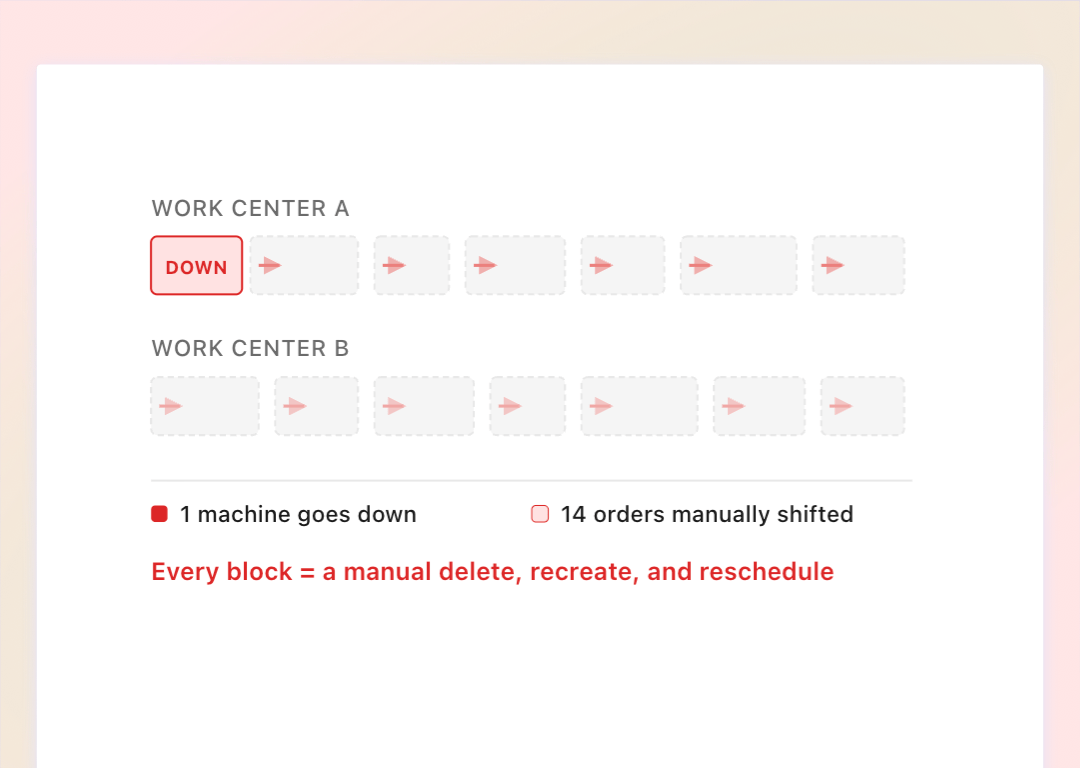
One Breakdown, 20 Manual Fixes

When a machine goes down, planners manually delete, recreate, and shift dozens of dependent orders. One disruption cascades into a full day of rework.

Upload media

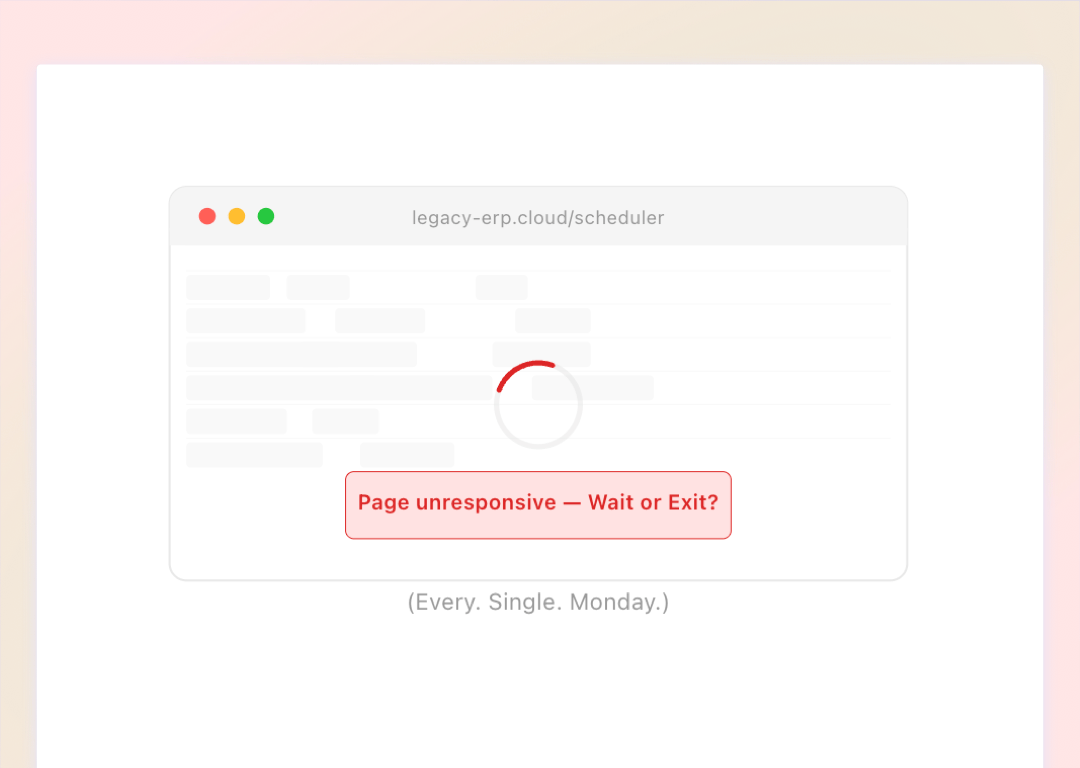
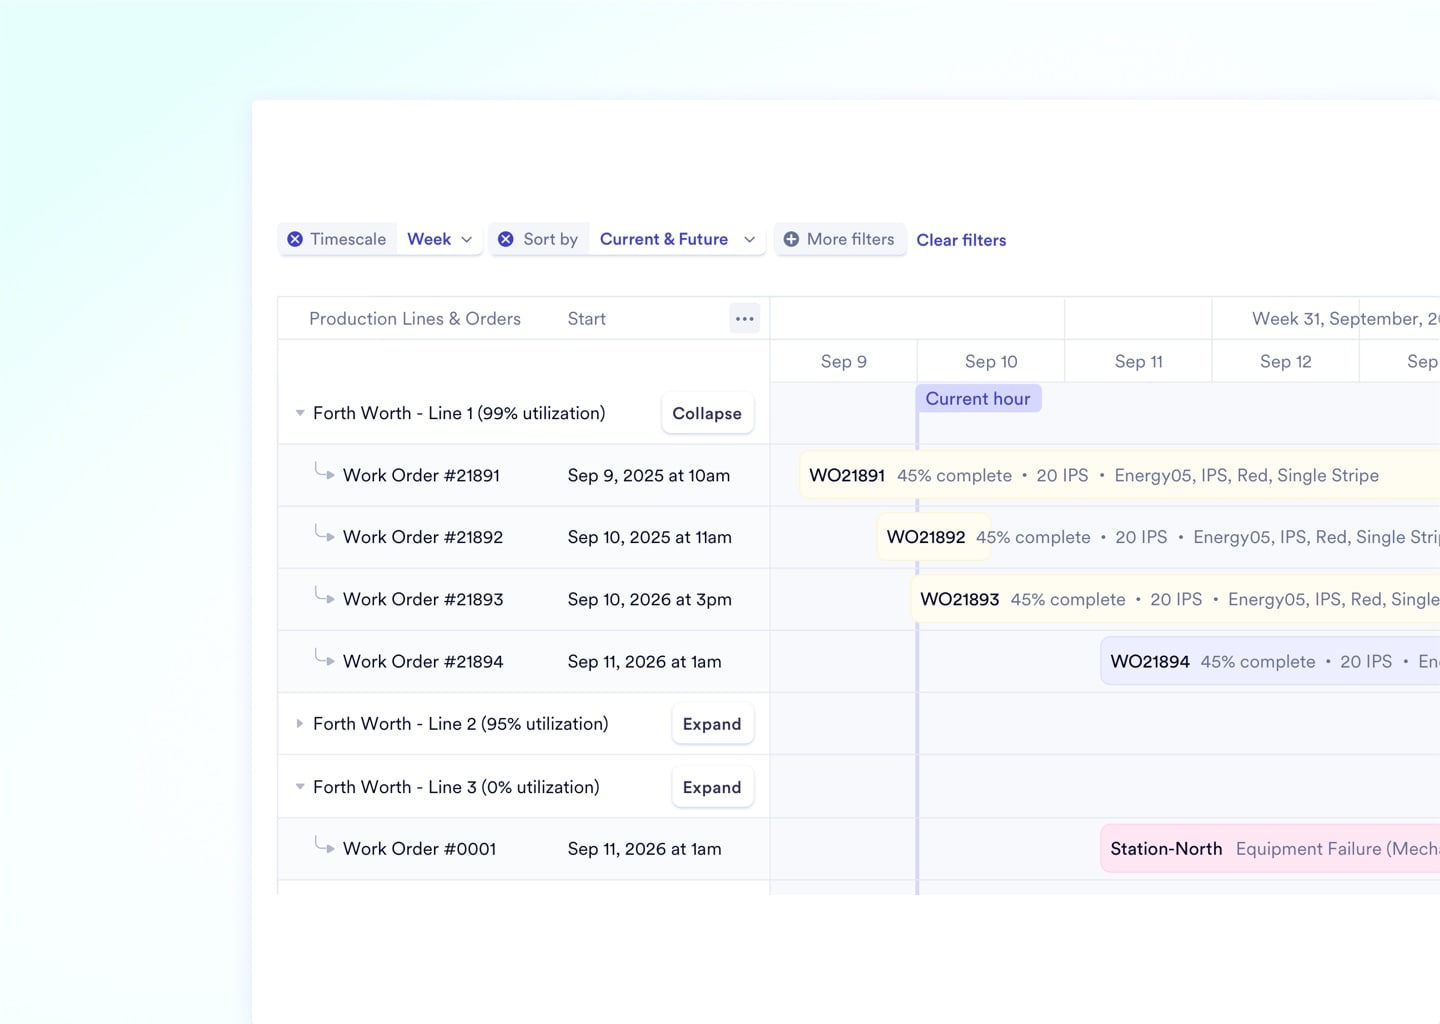
Browser Freeze at 100 Orders

Standard web-based Gantt charts crash under enterprise data loads. Planners abandon the tool and revert to whiteboards within weeks.

Upload media

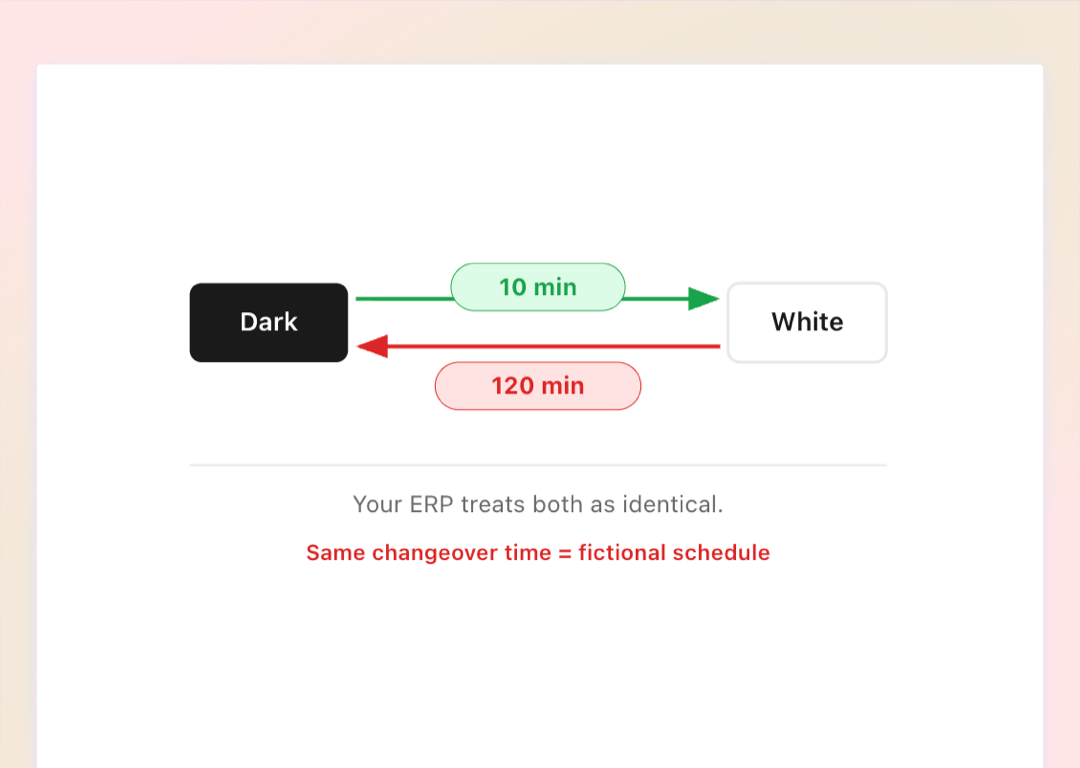
10 Minutes vs. 2 Hours, Same Machine

Switching from Dark to White resin takes 2 hours of deep cleaning. White to Dark takes 10 minutes. Basic ERPs treat both identically.

Upload media
Master Scheduler

Compress 50 Idle Gaps in One Click

The interactive Gantt timeline groups every manufacturing order by work center and renders them on a drag-and-drop canvas. When a machine goes down or a job finishes early, trigger the Reflow algorithm to automatically pull subsequent orders forward and eliminate dead capacity.

Drag-and-drop scheduling by work center
One-click Reflow closes dead capacity gaps
Filter by date, status, work center, or facility
Zoom from hourly to quarterly timescales
10,000+ concurrent orders at 60fps
Maintenance blocks auto-placed on downed machines
Add images via component properties
Capacity time standards

Every Setup, Cleanup, and Changeover Calculated Before You Schedule

Schedules that account for pure run time are fiction. Naologic forces every machine to declare its hidden time - exact setup durations, post-run cleanup windows, and directional partial changeover penalties. The scheduling engine automatically reserves these non-productive blocks before a single order is placed.

Default Setup and Cleanup Durations

Define standard prep and teardown times at the work center level. The scheduler automatically inserts these temporal blocks before and after every manufacturing order, preventing the overbooking cascade that collapses daily plans.

Configured per work center in Manufacturing Settings

Directional Partial Changeover Matrices

Build from-to changeover logic per machine. White-to-Black resin costs 10 minutes, but Black-to-White costs 2 hours of deep cleaning. The scheduler clusters similar jobs together to minimize total changeover downtime.

Auto-Sequence tool leverages the matrix to sort queued jobs by changeover efficiency
Production intelligence

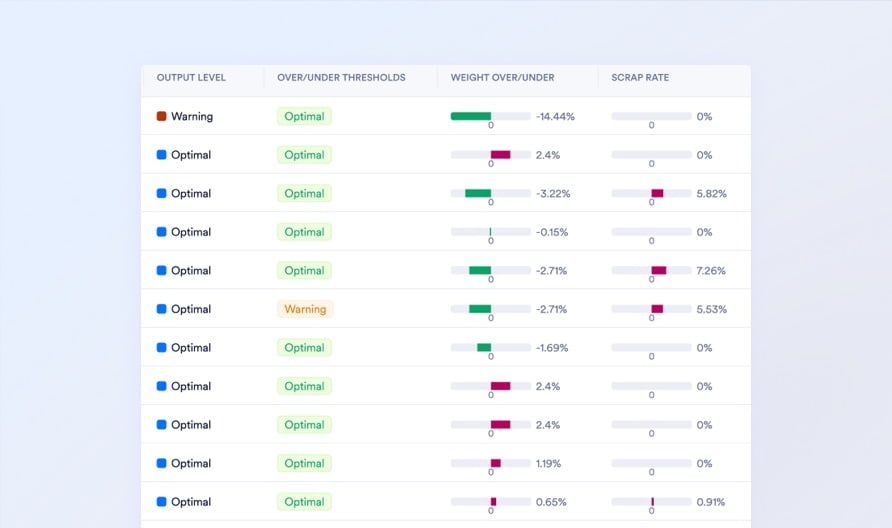
Actual Output vs. Engineered Standard, Scored Automatically

Per-Shift Efficiency Scoring

Cross-reference operator output against engineered baselines per product per machine. Know instantly if a shift runs at 85% or 110%.

  • Actual vs. standard output per hour
  • Efficiency % calculated by shift
  • SKU-specific machine velocity baselines
  • Zero manual math required

Performance Drop Alerts

When a machine drops below target speed or over-consumes raw materials, the system pushes an alert to the floor manager's phone.

  • Configurable tolerance thresholds per machine
  • SMS, email, and in-app routing
  • Sustained variance triggers, not one-off spikes
  • Alerts route to the right manager automatically

Color-Coded Threshold Labels

Every production report is auto-tagged green, grey, or red based on variance from standard. Scroll 500 reports and spot every underperformer instantly.

  • Green: over-performing
  • Grey: within standard
  • Red: under-performing
  • Replaces Excel VLOOKUP audits

Scrap Root Cause Isolation

ross-reference waste data by operator, product line, or individual machine over time. Pinpoint the exact source of your material loss.

  • Historical scrap trend dashboards
  • Machine-vs-machine waste comparison
  • Per-product defect rate isolation
  • Turn waste data into margin recovery
Production reporting

Output, Scrap, Downtime, and Shift Data in One Report

The Production Report captures granular telemetry for every completed job - actual output per hour, total scrap weight, categorized downtime reasons, and shift attribution. Every report is permanently tied to the manufacturing order, the operator, and the exact machine.

See Production Reporting
Production Report Builder
Report Calendar by Facility
Labor Performance by Shift
Scrap Rate Analysis
Threshold Performance Labels

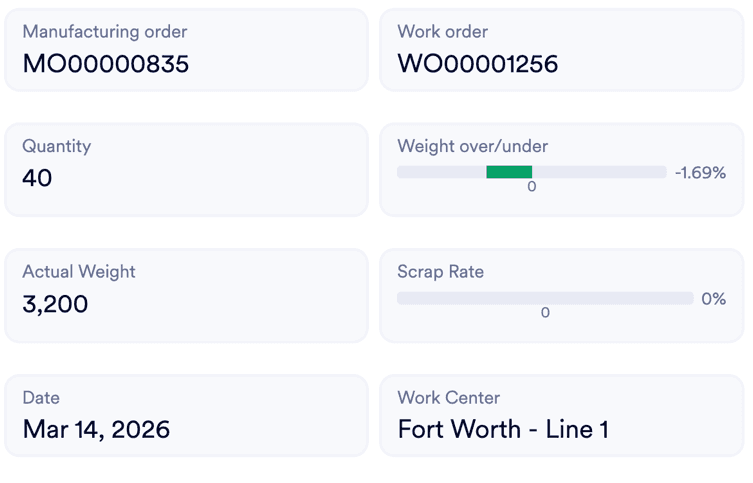
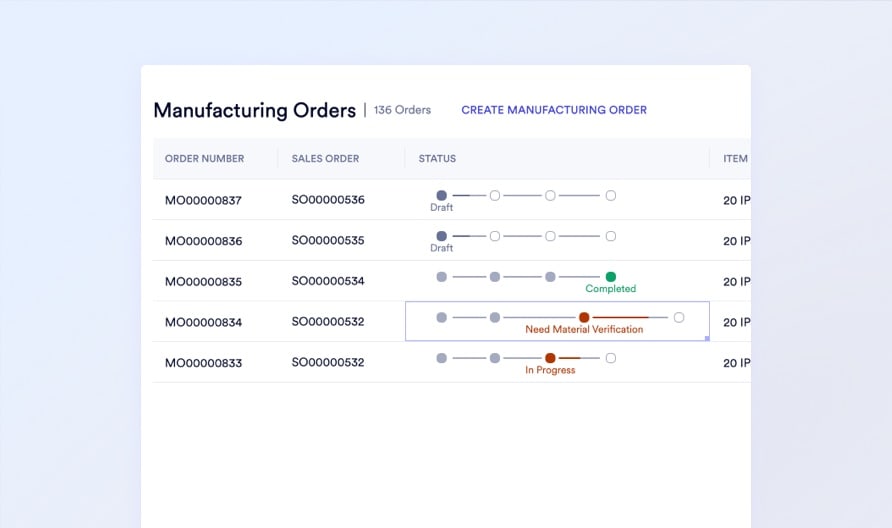
Planned vs. Actual Cost Tracked at Every Routing Step

Manufacturing orders break down into individual work orders, rework loops, and material verification tasks. Naologic tracks independent cost, time, and approval chains at every step so you isolate exactly where margin disappears.

No image

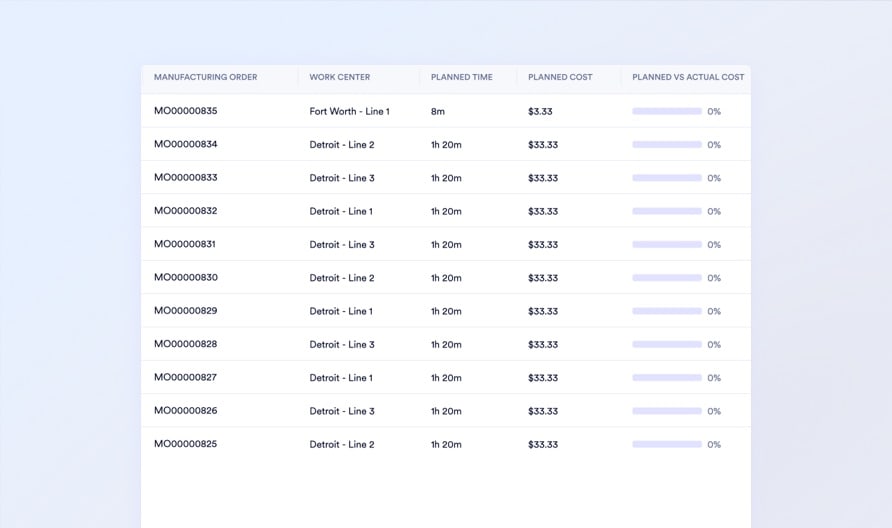
Work Order Cost Variance

No image

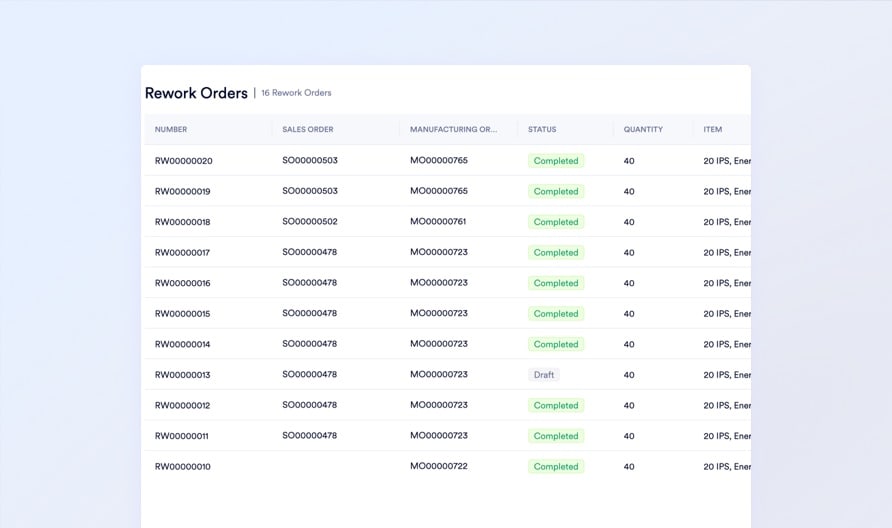
Rework COPQ Tracking

No image

Pre-Run Cycle Count Triggers

No image

Real-Time Performance Alerts

Work center configuration

Every Machine's True Cost, Speed, and Constraints - Digitized

Replace tribal knowledge with physics

6.5 hrs

Average productive capacity per 8-hour shift once setup, cleanup, and changeover durations are factored in

SKU-Specific Output Velocities

Product A runs at 500 units/hour, Product B at 100. Map exact throughput rates per product per machine so the scheduler calculates perfectly accurate run times.

Capacity and Availability Enforcement

From-To Changeover Matrices

Fully Burdened Hourly Cost Rates

One-Tap Downtime With Schedule Blocking

Upload an image or video

10,000 Orders on Screen. Zero Freezing.

Most scheduling tools choke past 100 orders - yours probably already has. Naologic's timeline handles your entire factory at full speed. Pan across months, zoom from hours to quarters, and drag jobs between machines without waiting for the screen to catch up.

naologic
Discover Bank
Capital One
Baxter Credit Union
First Commonwealth Bank
Citadel Federal CU
Robins Financial CU
Community Bank
Boeing ECU
Academy Bank
US Bank
Spokane FCU
Regions Bank
KeyBank
Arvest Bank
American Express
Woodforest Bank
PNC Bank
Utah Community CU
Navy Federal CU
TD Bank
Discover Bank
Capital One
Baxter Credit Union
First Commonwealth Bank
Citadel Federal CU
Robins Financial CU
Community Bank
Boeing ECU
Academy Bank
US Bank
Spokane FCU
Regions Bank
KeyBank
Arvest Bank
American Express
Woodforest Bank
PNC Bank
Utah Community CU
Navy Federal CU
TD Bank
First Commonwealth Bank
Citadel Federal CU
Golden 1 Credit Union
Woodforest National Bank
Teachers CU
Huntington Bank
Fifth Third Bank
BECU
Ally Bank
BMO Harris
M&T Bank
USAA
Simmons Bank
First Hawaiian Bank
Eastman CU
Alpine Bank
Empower CU
Synchrony Bank
Discover Bank
First Commonwealth Bank
Citadel Federal CU
Golden 1 Credit Union
Woodforest National Bank
Teachers CU
Huntington Bank
Fifth Third Bank
BECU
Ally Bank
BMO Harris
M&T Bank
USAA
Simmons Bank
First Hawaiian Bank
Eastman CU
Alpine Bank
Empower CU
Synchrony Bank
Discover Bank
VyStar Credit Union
Simmons Bank
T Bank
Bank of Hawaii
Patelco Credit Union
Hills Bank & Trust
Mountain America CU
Fidelity Investments
Old National Bank
First Tech FCU
Capital One
Citibank
Charles Schwab
Vanguard
HomeStreet Bank
Pacific Premier
Lake Michigan CU
Wells Fargo
Chase
Citizens Bank
VyStar Credit Union
Simmons Bank
T Bank
Bank of Hawaii
Patelco Credit Union
Hills Bank & Trust
Mountain America CU
Fidelity Investments
Old National Bank
First Tech FCU
Capital One
Citibank
Charles Schwab
Vanguard
HomeStreet Bank
Pacific Premier
Lake Michigan CU
Wells Fargo
Chase
Citizens Bank
Goldman Sachs
Horizon Bank
State Employees CU
Truist
SoFi
Marcus
E*TRADE
Comerica
Glacier Bank
Columbia Bank
Randolph Brooks FCU
Fairwinds Credit Union
Navy Federal CU
TD Bank
Teachers CU
Huntington Bank
Fifth Third Bank
BECU
Ally Bank
BMO Harris
Goldman Sachs
Horizon Bank
State Employees CU
Truist
SoFi
Marcus
E*TRADE
Comerica
Glacier Bank
Columbia Bank
Randolph Brooks FCU
Fairwinds Credit Union
Navy Federal CU
TD Bank
Teachers CU
Huntington Bank
Fifth Third Bank
BECU
Ally Bank
BMO Harris
ESL Federal Credit Union
Wells Fargo
Huntington Bank
Bank of the West
First United Bank
Boeing ECU
Academy Bank
US Bank
Spokane FCU
Regions Bank
KeyBank
Arvest Bank
American Express
Woodforest Bank
PNC Bank
Utah Community CU
Navy Federal CU
TD Bank
Discover Bank
Capital One
ESL Federal Credit Union
Wells Fargo
Huntington Bank
Bank of the West
First United Bank
Boeing ECU
Academy Bank
US Bank
Spokane FCU
Regions Bank
KeyBank
Arvest Bank
American Express
Woodforest Bank
PNC Bank
Utah Community CU
Navy Federal CU
TD Bank
Discover Bank
Capital One

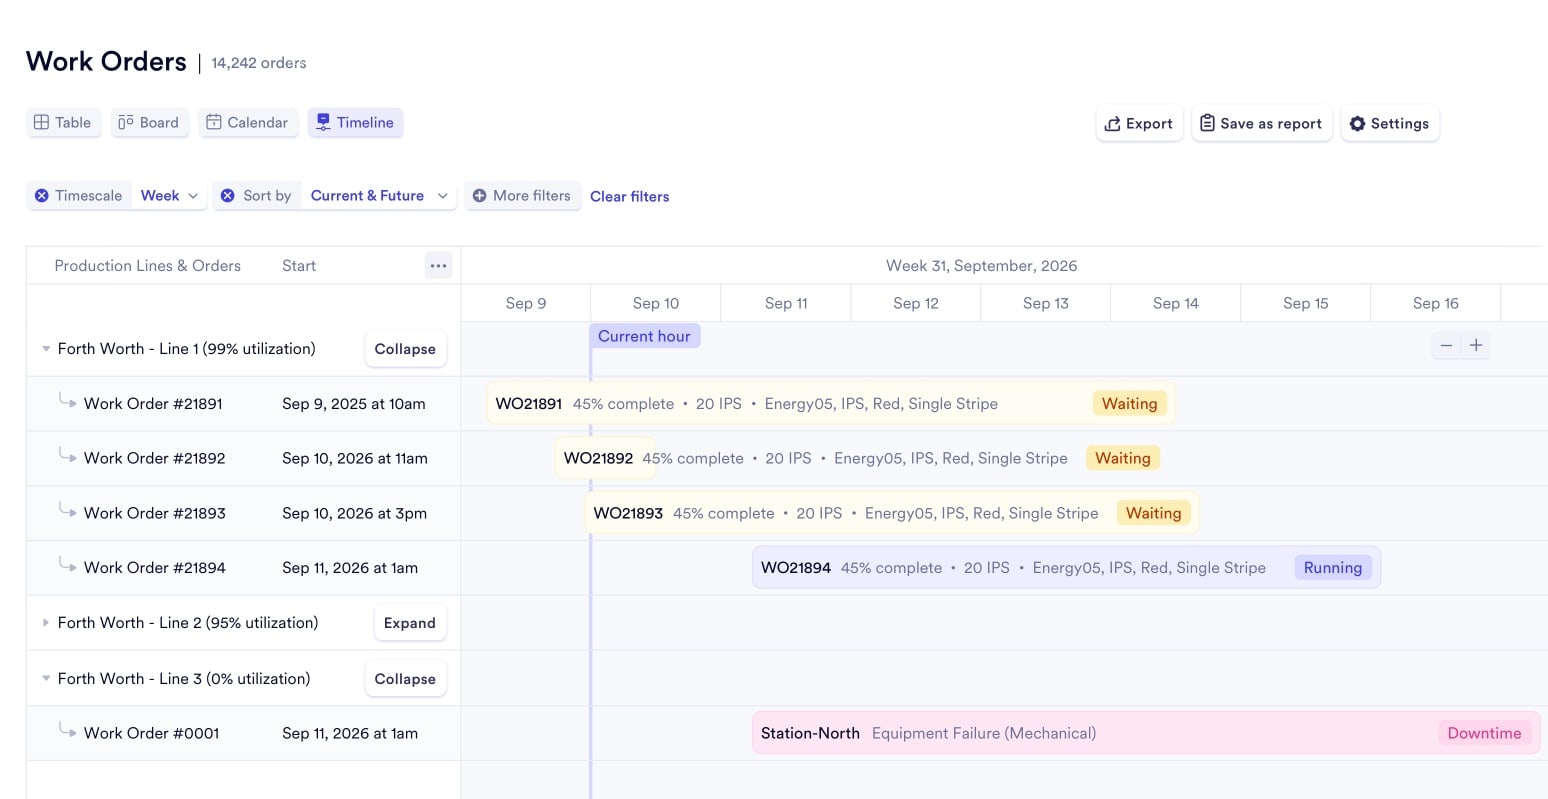
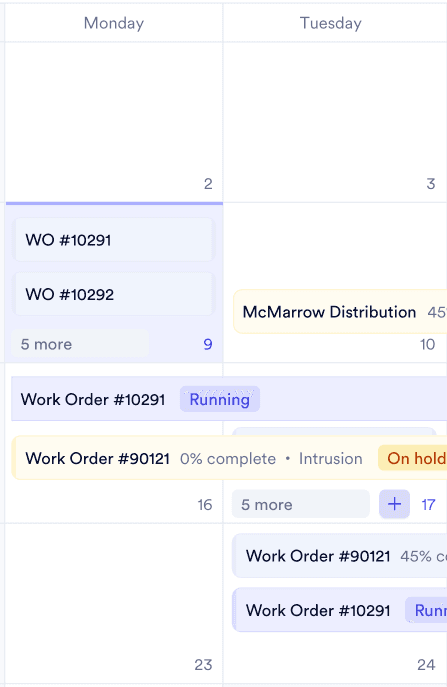
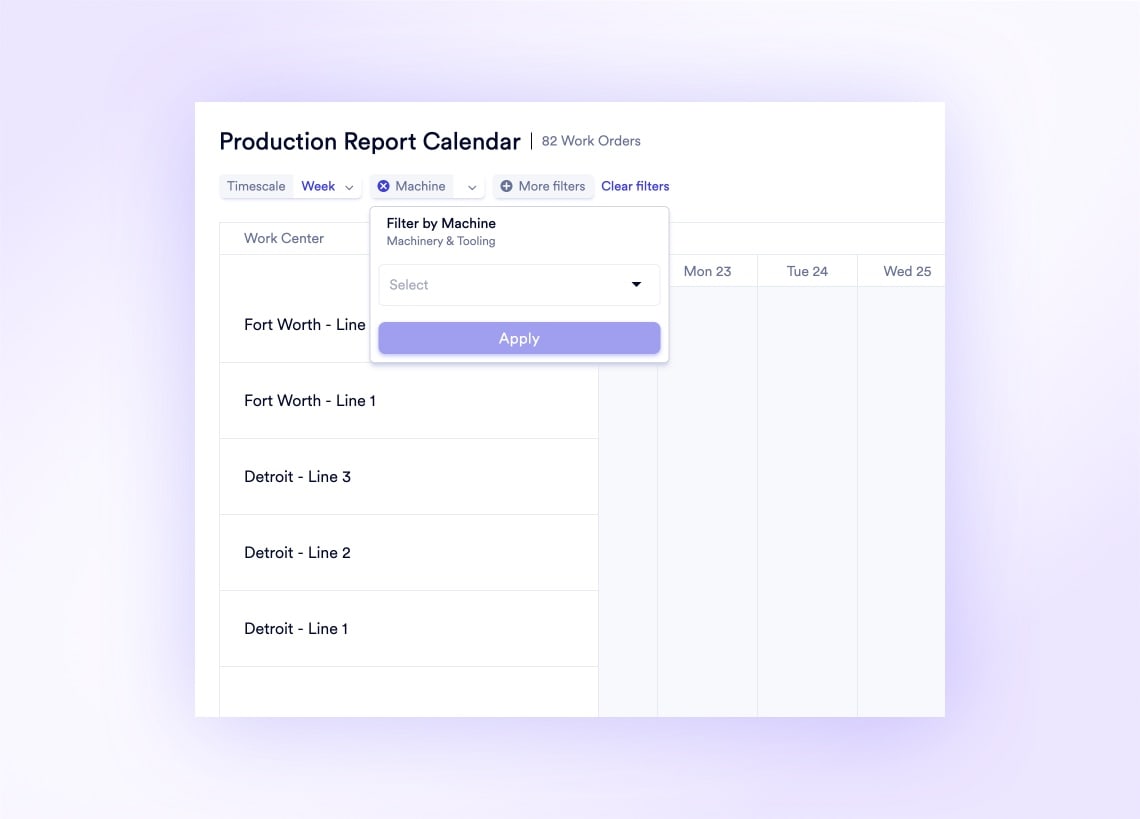
Production report calendar

See What Every Machine Produced on Any Given Day

The Production Report Calendar plots finalized output data by manufacturing date, work center, and facility on an interactive visual timeline. Filter by facility to audit specific zones instead of scrolling through 200 flat spreadsheet rows.

Drop image here

Isolate Margin Leaks at Every Production Step

Step-Level Cost Tracking Break massive jobs into machine-level Work Orders. Track planned vs. actual cost independently for cutting, welding, and painting to pinpoint exactly where you bleed margin.

Explore Work Orders

Rework Cost Accountability When parts fail QA, issue dedicated Rework Orders that route defects back through the factory. Capture the exact Cost of Poor Quality hidden from your CFO.

Explore Rework Orders

Raw Material Spot-Checks Trigger targeted cycle counts from the operations dashboard before high-priority runs. Force the warehouse to physically verify critical raw materials are on the shelf.

Explore Cycle Counts

Why teams switch

Naologic vs. Whiteboards, Spreadsheets, and Legacy ERPs

Your current scheduling setup - whether it is a dry-erase board, a fragile Excel macro, or SAP Business One, NetSuite, or Odoo - was not built for the speed, scale, and changeover complexity of a modern factory floor.

Scheduling Engine
Interactive drag-and-drop Gantt timeline
One-click Reflow to compress dead capacity gaps
10,000+ concurrent orders without browser lag
Scheduling filters by facility, machine, status, priority
Hourly to quarterly zoom on a single timeline
Capacity Intelligence
Setup, cleanup, and changeover durations auto-calculated
Directional partial changeover matrices (from-to logic)
SKU-specific machine output velocities
Strict capacity enforcement preventing overbooking
Machine-specific over/under tolerance thresholds
Production Reporting
Auto-generated reports with output, scrap, downtime, shift data
Color-coded over/under performance threshold labels
Scrap rate analytics by machine, operator, and product
Visual production report calendar by facility
Labor performance analysis with shift attribution
Operations
Work orders with independent cost tracking per routing step
Dedicated rework order workflows with COPQ tracking
In-module cycle count triggers for raw material verification
Real-time downtime logging with automatic schedule blocking

Calculate Your Factory's Hidden Scheduling Losses

Schedules that ignore setup time, changeover complexity, and real machine capacity cost mid-sized factories $200K-$500K annually in lost throughput, overtime labor, and missed delivery penalties. This guide walks you through auditing your current scheduling accuracy and quantifying the exact gap.

Operations GuideHow to Audit Your Factory Schedule and Find $200K in Hidden Losses

See the Drag-and-Drop Scheduler Live Walk through the interactive timeline, Reflow optimization, and production reporting with a Naologic manufacturing specialist. 30 minutes, no commitment.

Book a Demo

Explore the Full Manufacturing Module Dive deeper into manufacturing orders, routing strategies, work center configuration, and shop floor execution across every Naologic manufacturing capability.

See All Manufacturing Features