AI Reports

Ask Any Manufacturing Question. Get a Live Dashboard in Seconds.

Query your entire production, financial, and operations data lake using plain English - no SQL, no IT ticket, no PowerBI license required.

PearsonmuRataPipelineTIRDirectMedSupplieseDevizeEnviromericaMarktool
Intelligence, Built In

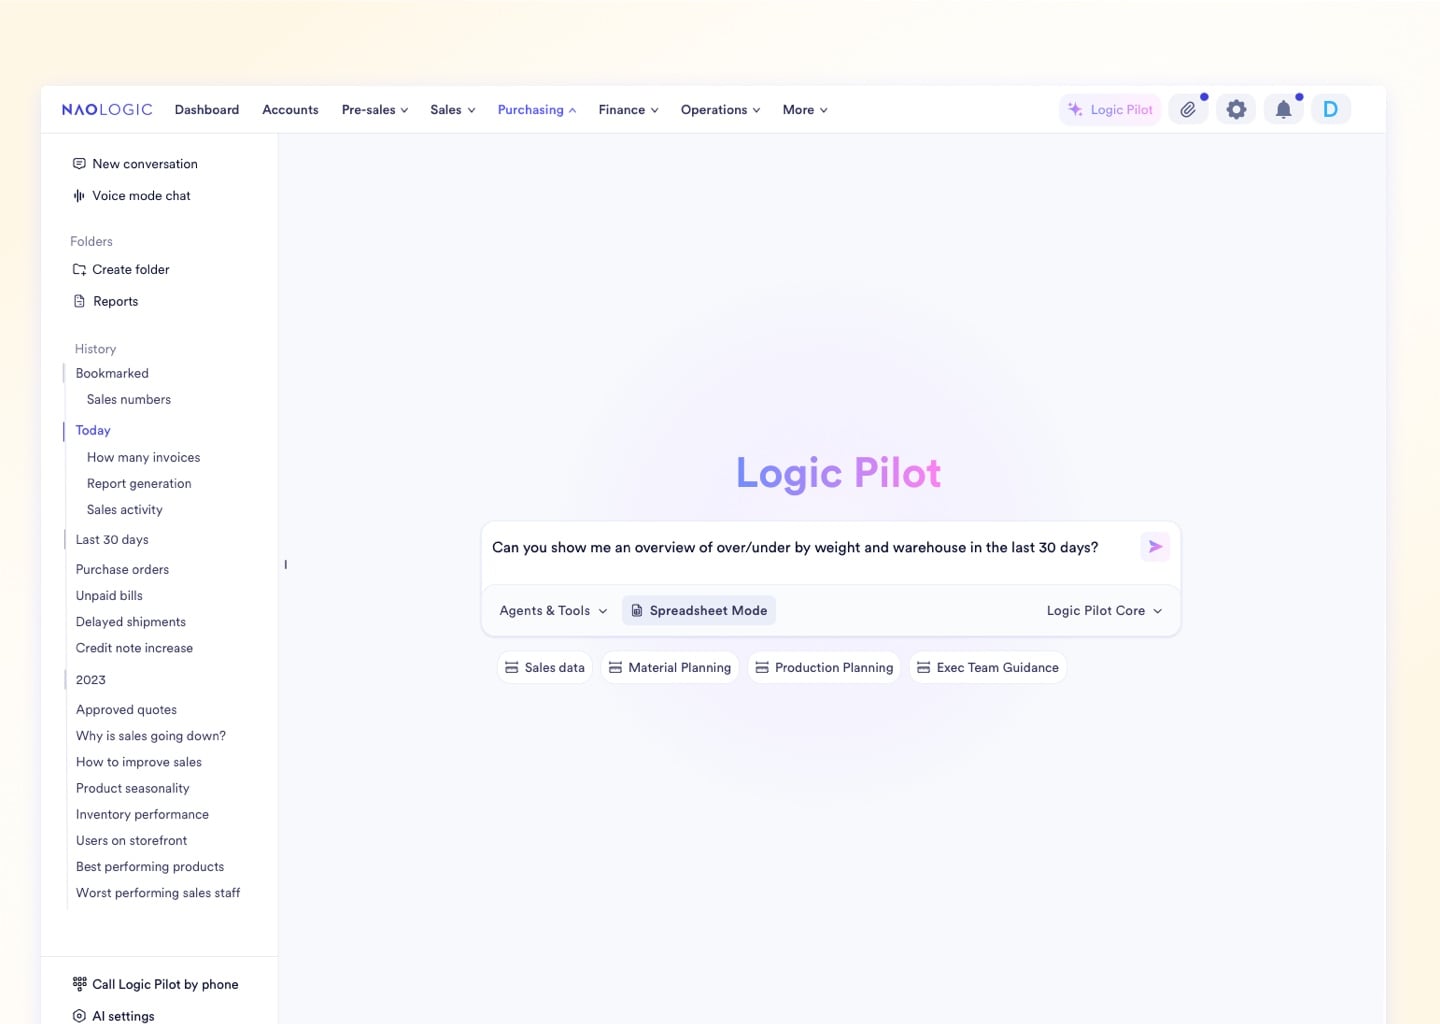
Zero BI Licenses. Zero SQL. 100+ Visualization Types.

Naologic's native BI layer connects every module - shop floor, finance, purchasing, quality, and sales - into one unified data environment. Every metric is queryable, every table is filterable, and every answer arrives in seconds without a developer in the loop.

1000+
distinct visualization types built natively into the report builder - from geographic heat maps to Sankey charts
Zero
IT tickets required to build a custom cross-module dashboard from scratch
3 sec
typical time from a plain-English question to a fully rendered live data table
$0
third-party BI license needed - no PowerBI, no Tableau, no Crystal Reports add-on required

Every data source in your factory feeds one reporting hub. From raw barcode scans on the shop floor to final GL journal entries, every telemetry point flows into a unified, natively connected data environment - queryable at any depth, by any user, at any time.

Shop Floor MOs
Financial Ledger
Sales Pipeline
Inventory Telemetry
Quality Records
Natural Language
AI Report Builder
N
SAP
Dashboard Layer
naologic
Data Pipeline
Visualization Engine
Email Delivery
SMS Alerts
Spreadsheet Mode
Visual Report Mode

Natural Language Querying

From Plain-English Question to Pinned Dashboard in 4 Steps

Any user - regardless of technical background - can build a permanent, live-updating BI dashboard without writing a single line of SQL or filing a single IT ticket.

1

Ask in Plain English

Type any question into the AI Report Builder. Ask complex cross-module queries like "Show me scrap rate by machine vs. material cost for Q3" and the system parses your intent instantly.

2

AI Translates to Live Data

The natural language engine converts your question into a secure query against your live data lake - spanning every module from production to finance - and returns the exact matching dataset.

3

Select Your Visualization

Choose from over 100 visualization types: bar, scatter, heat map, Sankey, waterfall, and more. The AI auto-recommends the best chart type based on your data's structure and dimensions.

4

Pin to Your Dashboard

Save the live-updating widget to any Private or Public Dashboard with one click. The report re-runs against fresh data every time it loads - no re-configuration, no manual refresh.

Upload media for "Ask in Plain English"

5 Reporting Modes Covering Analytics, Production, and Finance

Every user type - from the CEO to the production manager - gets the exact data format they need, natively inside the workspace.

Factory Floor Reports That Write Themselves After Every Completed MO

Every finished manufacturing order automatically generates a production report with exact costs, yields, and scrap metrics. No manual operator math, no Friday CSV exports - the data is captured digitally at the point of work and compiled the moment the order closes.

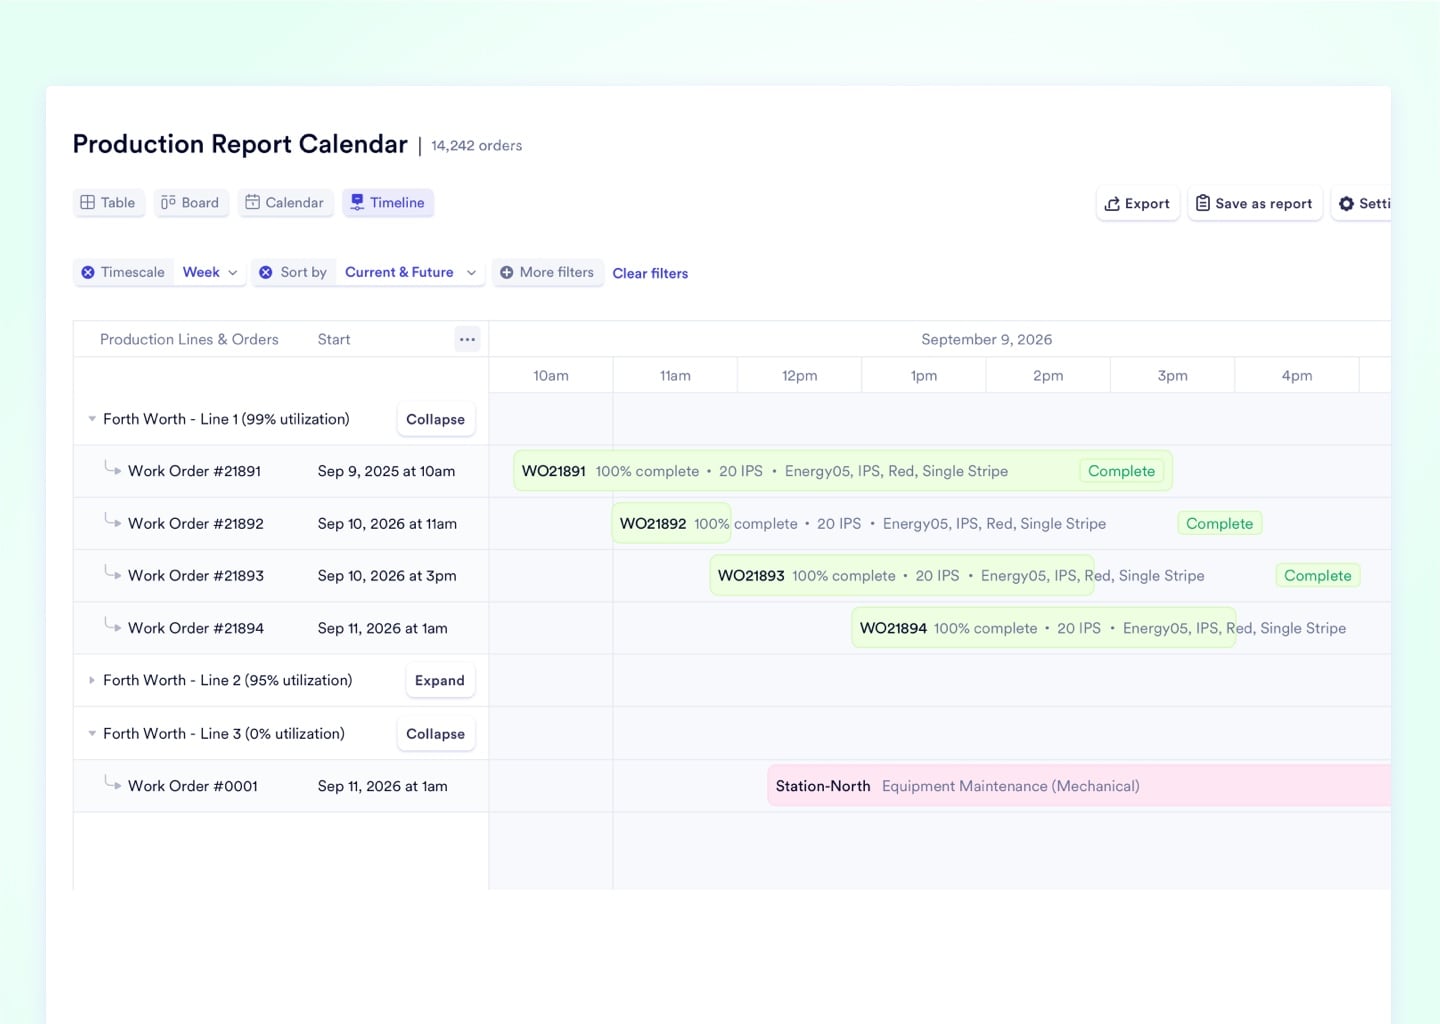
Production Report Calendar

Completed production reports are plotted on an interactive calendar by date and work center. Managers get a visual post-mortem of any day, machine, or facility without opening a single spreadsheet.

Upload media

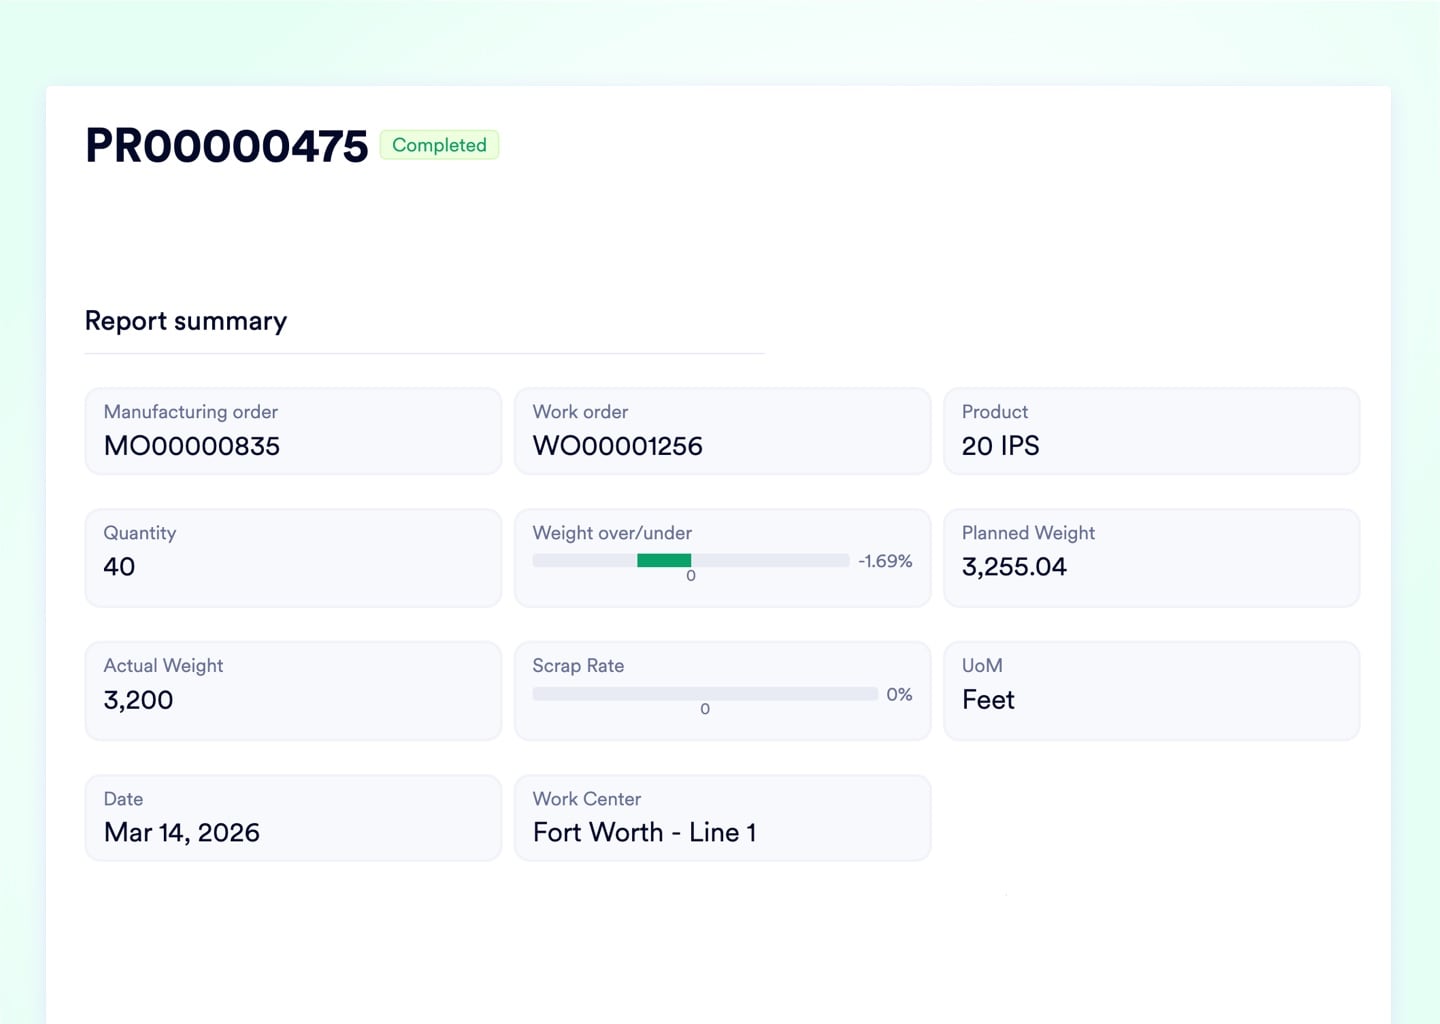
Automatic Report Generation for Completed MOs

When a Manufacturing Order closes, the system instantly compiles exact times, material consumption, and final cost - no operator paperwork, no manual data entry, no accounting delay.

Upload media

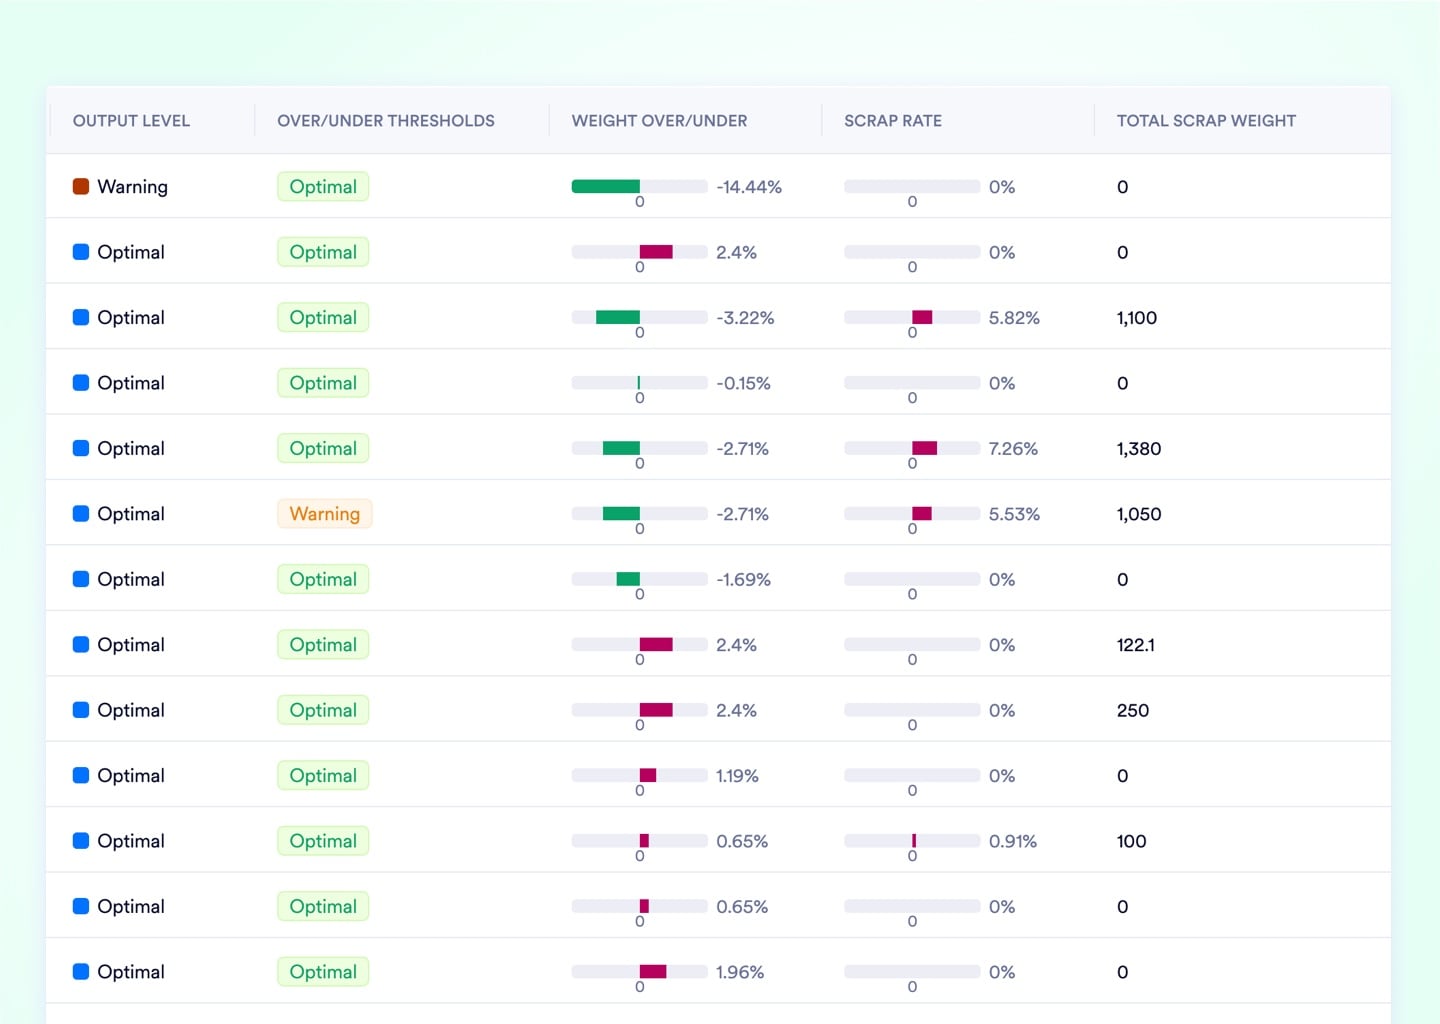
Scrap Rate Calculations and Visualizations

Live scrap percentages are visualized directly on the active order table with conditional red formatting on threshold breach - stop the machine before the margin disappears.

Upload media

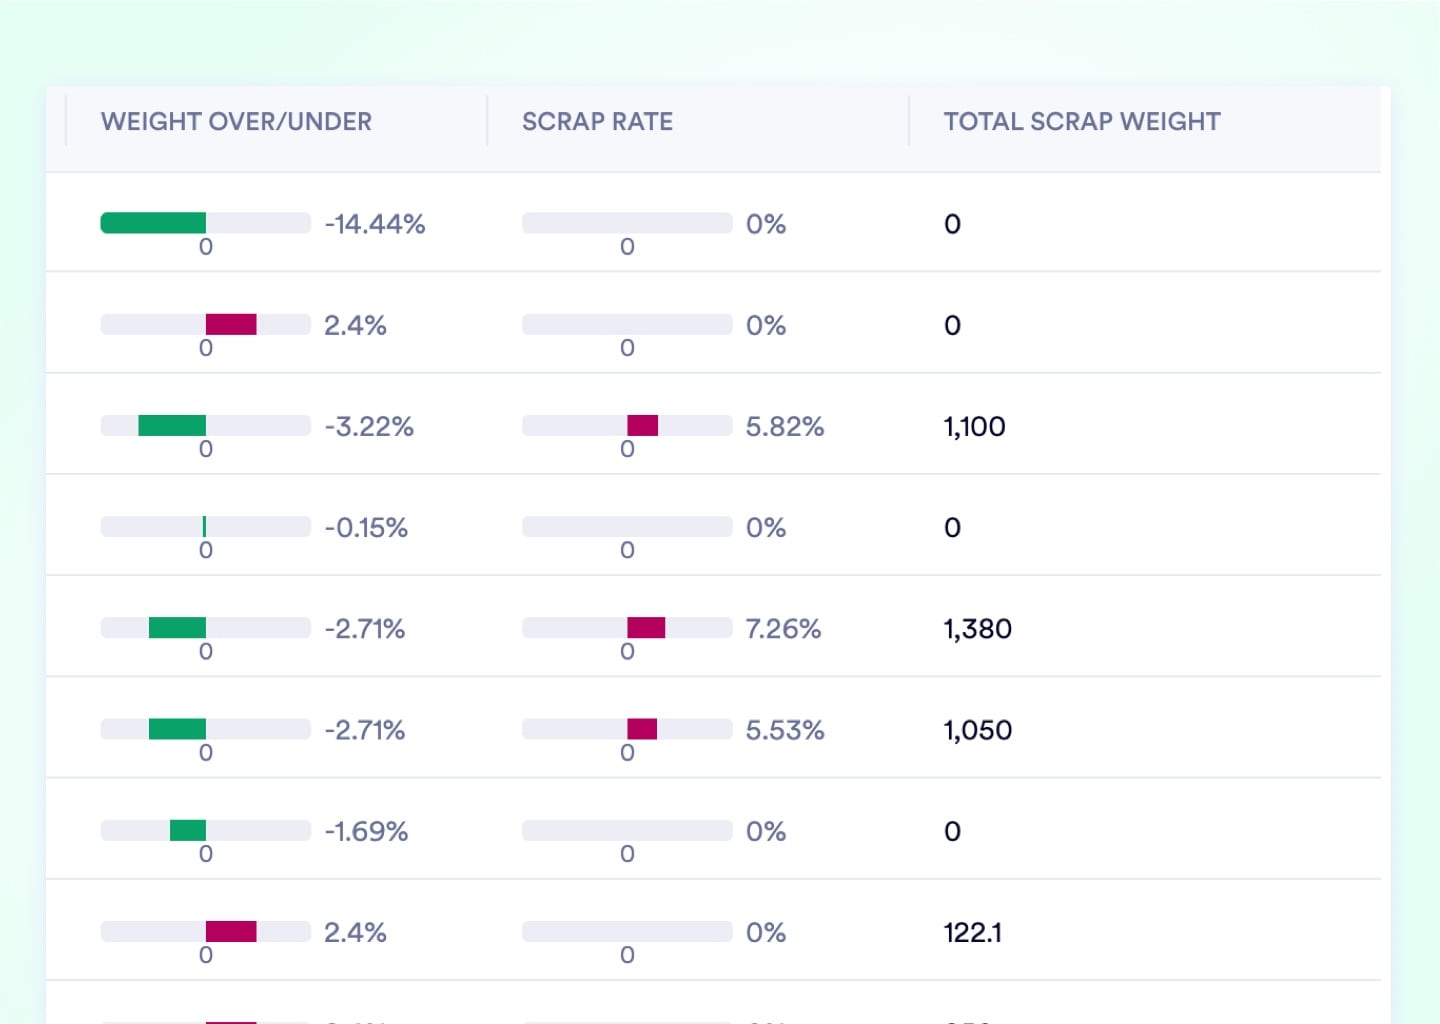
Over/Under Threshold Labeling

Historical production reports are auto-tagged with color-coded efficiency badges. Scroll through 500 reports and spot every under-performing run in seconds - no pivot table required.

Upload media

4 Data Table Tools That Replace Excel's Pivot and Filter Logic

Every table across the entire Naologic workspace is interactive, filterable, groupable, and AI-enrichable. Stop exporting CSVs to answer questions your ERP should answer directly, in-place.

No image

Interactive Tables

No image

Pivot Tables

No image

Advanced Filtering

No image

Table Logic Pilot

Replace Legacy Tools

Replace Crystal Reports, PowerBI, and Excel Exports With 1 Native Layer

Legacy ERPs force manufacturing operations into a cascade of tools just to answer basic questions: pay a developer to modify a Crystal Reports column, export a CSV, buy a PowerBI license, and hire a data engineer to wire up the connector - every single month. Naologic eliminates the entire stack. Every table, dashboard, financial drill-down, and production report is natively connected and instantly accessible from one workspace, with no external tools and no consultants in the loop.

See a Live Demo
Crystal Reports
Manual Excel Exports
PowerBI Add-On
Legacy ERP Reports
Third-Party BI Connectors
Full Feature Map

Every Reporting Capability From NL Queries to Table Logic Pilot

AI-Powered Querying
Natural language report builder
Report builder
Visual report mode
Spreadsheet mode
Custom AI reports and emails, delivered by text and email
Dashboards and Templates
Private and public dashboards
Custom report templates
System report templates
Over 100 visualization types
Interactive Data Tables
Interactive tables
Pivot tables
Row groups
Advanced filtering
Intelligent columns that remember your preferences
Table Exports
Table Column Nesting
Dynamic visualizations based on live table data
Table logic pilot
Production and Financial Reports
Income statements
Balance sheets
Production report calendar
Automatic generation of production reports for completed MOs
Scrap rate calculations and visualizations
Over/under threshold labeling
AI Delivery

Push Executive Summaries to Leadership Via Email and Text Every Monday

The most important metrics shouldn't require a dashboard login. Naologic's AI scheduling engine compiles weekly performance data - spanning sales margins, production yields, scrap trends, and cash positions - and automatically delivers a synthesized briefing to any distribution list, on any cadence you define.

Access-Controlled Intelligence by Role

Not every report belongs on every screen. Build highly sensitive executive analytics in Private Dashboards restricted to a single user, or publish Role-Restricted Dashboards that surface the right KPIs to the right departments. The operations manager sees yield data; the CFO sees cash flow; the CEO sees everything. Zero unauthorized data crossover.

Powered by: Private and public dashboards

Day-One ROI With Pre-Built System Templates

No blank canvas and no months of BI configuration. Naologic ships with dozens of System Report Templates covering sales pipelines, factory performance, AR aging, and operational costing. Deploy any template in one click - it auto-wires to your live data tables and starts producing accurate KPIs the moment your workspace goes live.

Powered by: System report templates + Custom report templates

Stop filing IT tickets for data your ERP already has. Book a live demo to see the full reporting suite - from natural language querying to automatic production reports - running against real manufacturing data.