


Every box moved. Every dollar accounted for. Zero manual reconciliation.
Most inventory systems record that a quantity changed. Naologic records what moved, where it went, which lot it belonged to, what it cost at the exact moment of transfer, and which GL account absorbed the financial impact - every single time, natively. No spreadsheet exports required.

Reporting Layers
From barcode events, formal scrap, rolling cycle counts, to quantity correction audits
Naologic captures every other inventory event in purpose-built, searchable modules. Each generates its own immutable, GL-linked record with no manual follow-up.
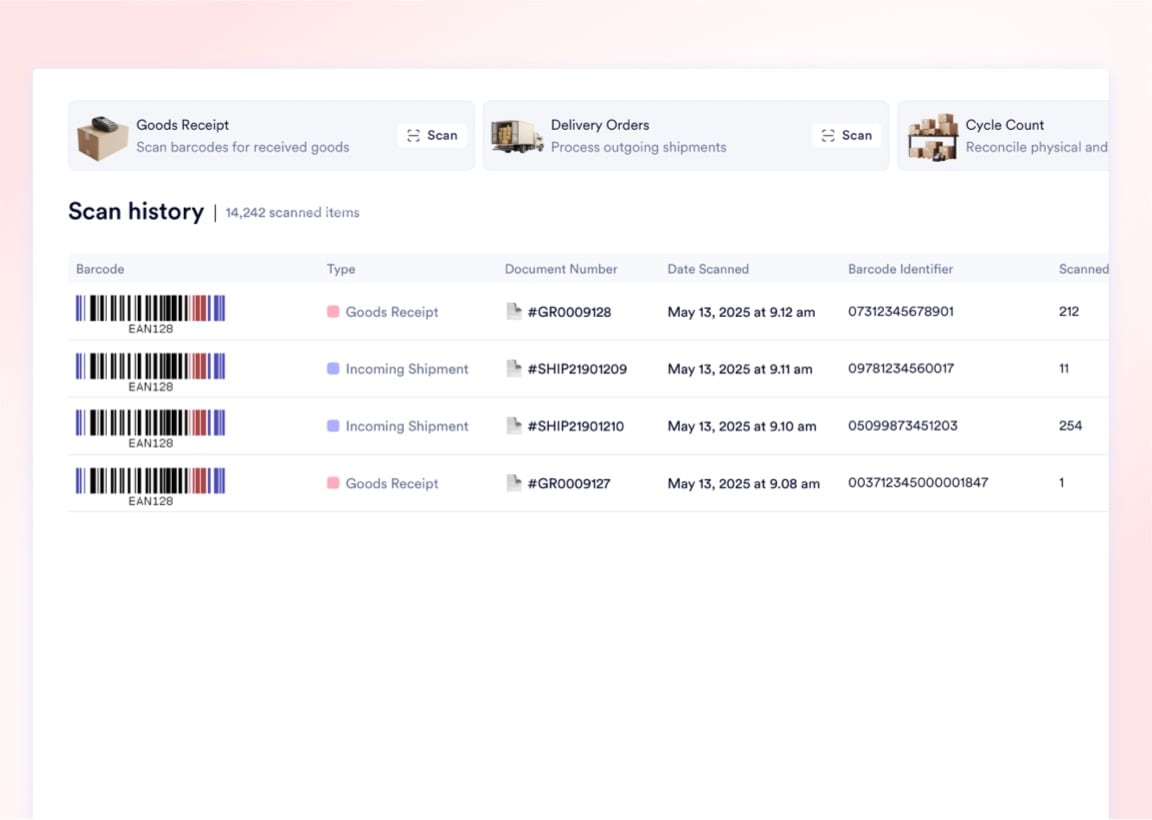
Barcode Scan History
A centralized, immutable log of every scan event across your facility. See which operator scanned which barcode, the originating module (Goods Receipt, Job Sheet, Transfer), and the exact timestamp for complete diagnostic auditing.
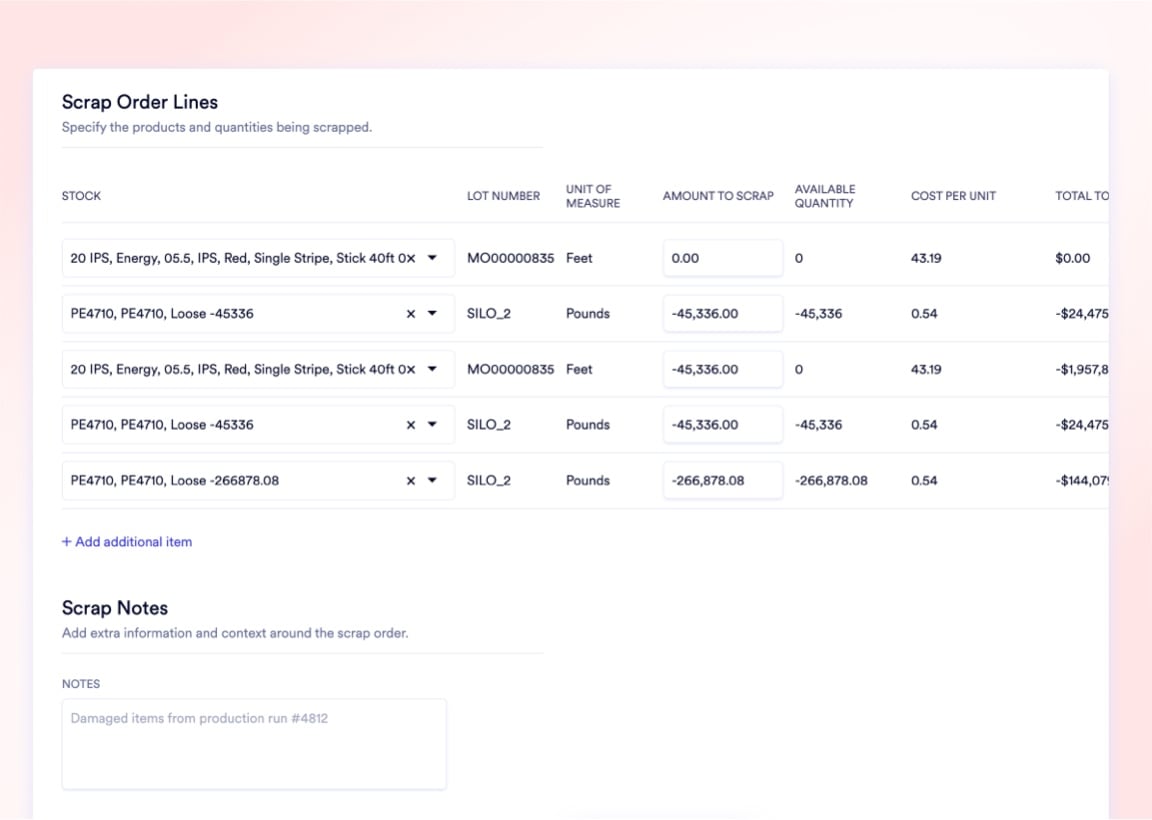
Scrap Orders with GL Write-offs
Formal scrap orders mandate an internal memo for root-cause tracking and automatically post the financial write-off to the designated Scrap GL account - no manual journal entries and no undocumented inventory loss.
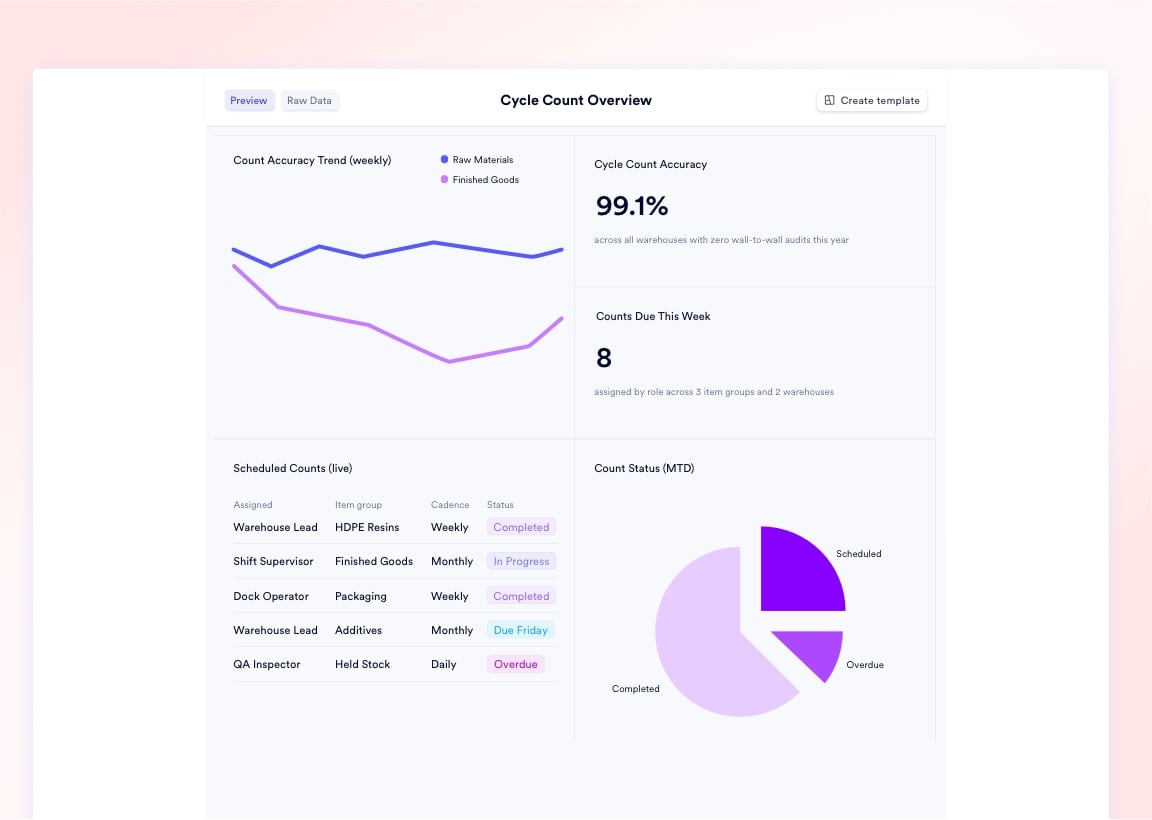
Cycle Count Accuracy Reports
Initiate rolling counts by zone or item category without halting production. Variances between physical and systemic quantities route for managerial approval and generate permanent correction events in the audit log.
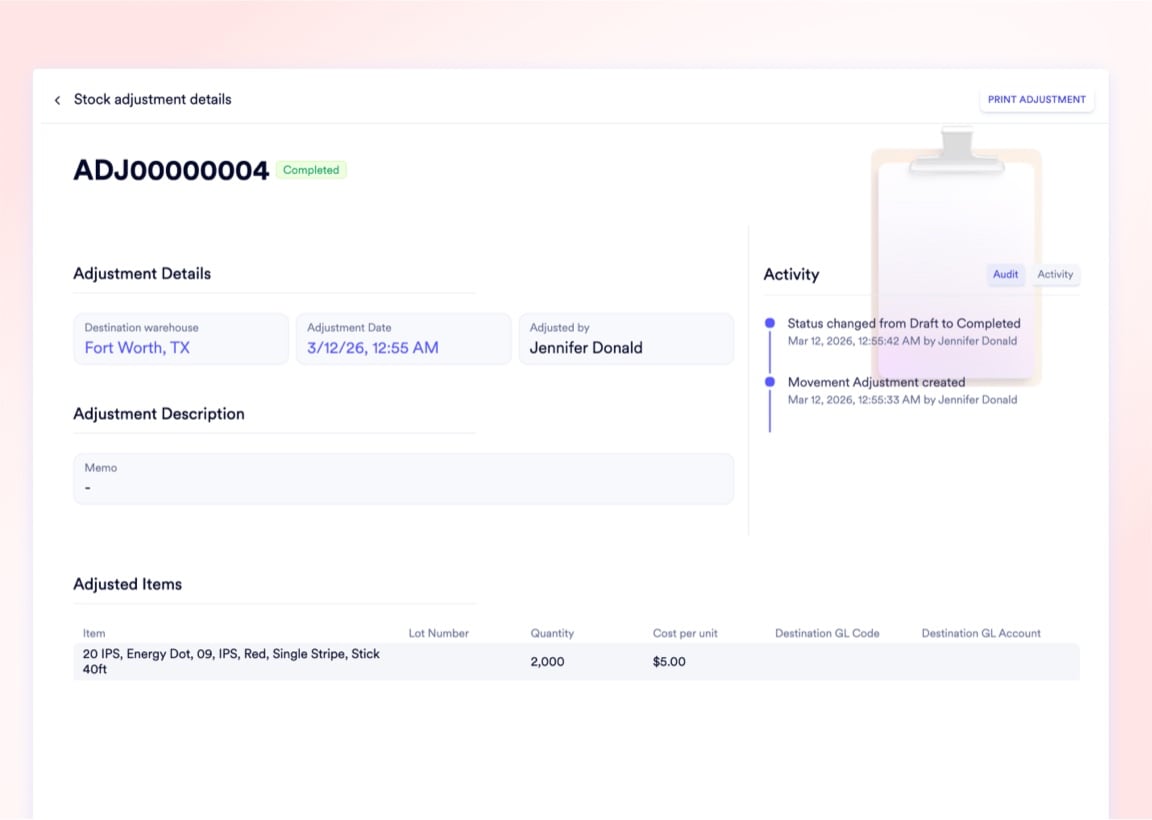
Stock Adjustment Correction Records
Every quantity correction requires an Adjustment Reason that routes the financial delta to the appropriate GL. Positive and negative variances are logged with user ID, timestamp, and full financial attribution.
Every inventory audit trail captures 6 data points per event - not just the quantity change
When inventory goes missing, basic logs only show that a number changed. Naologic's audit trails record the exact source document that triggered the movement, the operation type (receipt, transfer, pick, adjustment, scrap), the lot assignment, the user who executed the action, the timestamp to the second, and the GL accounts debited and credited. Answering "who moved it, when, why, and what did it cost the ledger?" takes seconds - not three days of forensic reconstruction before your auditor gets impatient.
GL Attribution
Item-level GL routing eliminates 2-3 days of month-end reclassification journal entries
Map specific Sales GL, Purchase GL, and Purchase Discount GL accounts directly on every item profile. When a part is received into inventory or shipped to a customer, Naologic automatically routes the revenue, COGS, and discount amounts to the exact correct ledger accounts - with zero manual reclassification required. Controllers at multi-SKU manufacturers eliminate the post-close reclassification sprint that typically runs 2-3 days per accounting period just to isolate product-line profitability in a flat accounting system.

Ask your inventory data questions without filing an IT ticket or writing SQL
Your financial controller shouldn't wait three days for a developer to generate an inventory valuation report. The Natural Language Report Builder translates plain-English questions directly into live inventory queries. Ask "Show me all items with negative stock across all warehouses this quarter" or "What is the total COGS value of all movements into customer shipments in March?" and get a formatted, drillable result instantly. Any result can be pinned as a permanent, auto-updating dashboard - no developer, no BI platform license, no exported spreadsheet that goes stale the moment you close it.


Native builder, pre-built templates, and saved custom reports - no external BI consultant required
Natural Language Report Builder
Type a plain-English question and the AI builds the exact query across your full inventory data lake. Results pin to permanent, live-updating dashboards with one click.
- Ask questions without SQL or formulas
- Queries run natively against all inventory data
- Results pin to live-updating dashboards
- Covers Movement History, Stock, and Audit data
Custom Report Templates
Build a complex, filtered inventory report once and save it as a template. Regenerate the identical dynamic data model next period with one click - no rebuild required.
- Save any filtered report configuration
- One-click regeneration each period
- Shareable across roles and user types
- Works for stock, cost, and movement reports
System Report Templates
Naologic ships pre-built templates covering stock valuation, movement summaries, shrinkage analysis, and location accuracy reports - deployed on day one with zero configuration.
- Active on day one with no setup
- Covers stock valuation and movement summaries
- Includes shrinkage and cycle count accuracy
- Industry-standard layouts out of the box
Workspace Audit Trails
Every action on any inventory record - creation, edit, approval, deletion - is permanently logged with the user ID and timestamp across the entire workspace and all connected modules.
- Full action log per inventory record
- User ID and timestamp on every event
- Immutable - no log entries can be deleted
- Covers all modules including Finance and Manufacturing


Reporting Performance
4 metrics that quantify the cost of operating without unified inventory reporting
Manufacturing controllers spend 2-3 days per month reconciling warehouse data against accounting ledgers using spreadsheets. Naologic consolidates physical inventory data and GL attribution into one native reporting engine - closing that gap without external tools, custom development, or month-end data archaeology.
2-3 days
per period spent manually reconciling inventory to GL using CSV exports and VLOOKUP formulas - eliminated with item-level GL attribution and native Movement History
0
external BI consultants or SQL developers needed to build combined lot traceability and financial reports - handled in plain English by the native AI report builder
4-level
location hierarchy in Stock by Location - parent warehouse, child warehouse, aisle, and specific bin - available with zero configuration on day one
100%
of inventory movements permanently linked to source document, operation type, user ID, and GL account - providing unassailable audit trails for any shrinkage investigation
Reporting Architecture
4 structural principles behind Naologic's inventory reporting engine
Immutable event ledger
Every inventory event is written once and never altered. Movements, adjustments, scrap, and count variances all generate permanent, timestamped records that cannot be deleted, modified, or backdated by any user.
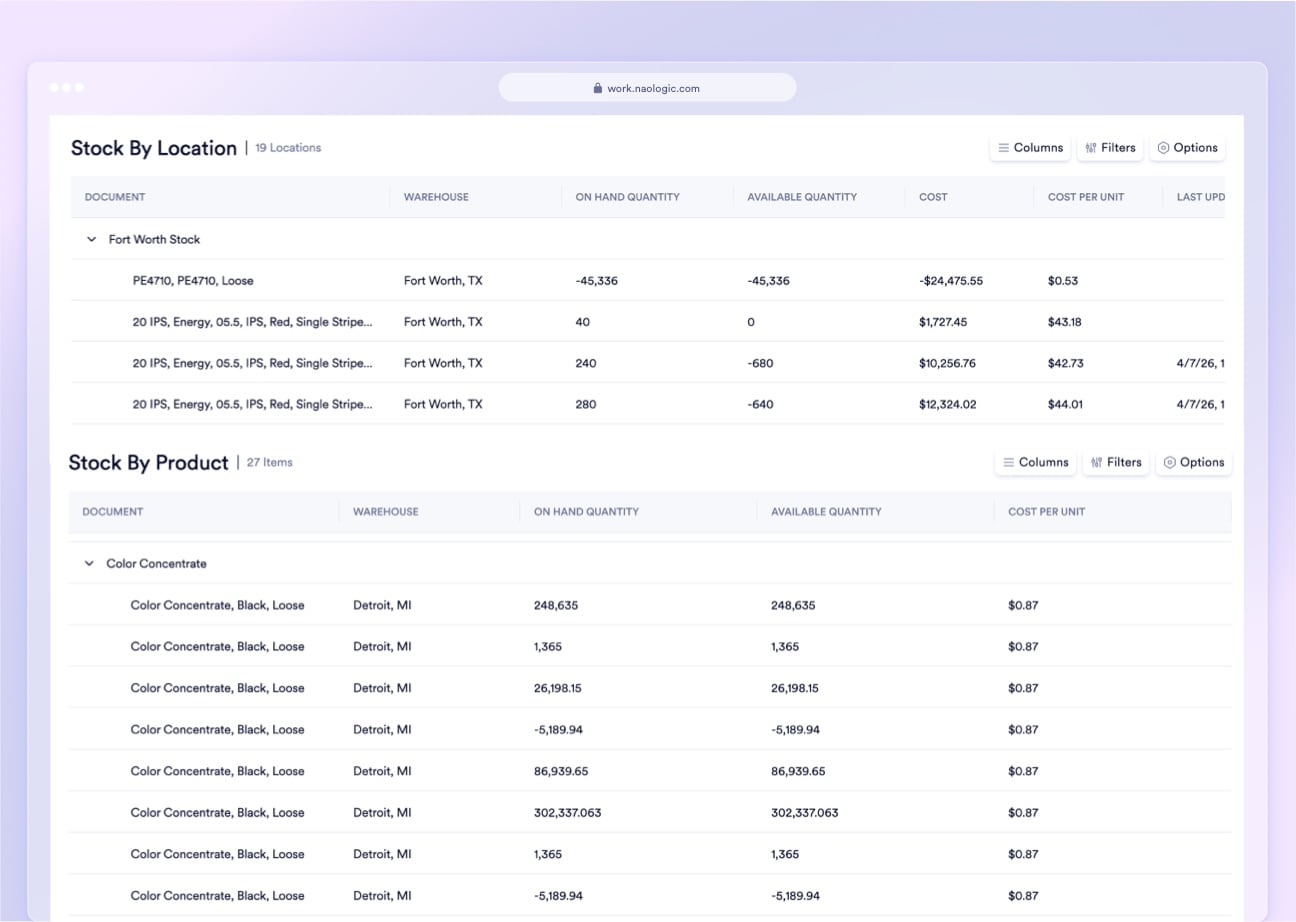
Hierarchical location drill-down
Stock by Location does not flatten your warehouse into a list. It maps your physical reality - parent warehouse, sub-location, aisle, bin - into a collapsible hierarchy navigated like a file system in seconds.
Every movement linked to its source document
Every stock movement record carries a direct, clickable hyperlink back to the exact order, receipt, or operation that triggered it. Trace any Movement History row to its originating document in two clicks.
GL impact embedded in every move
Movement History shows the exact unit cost at time of transfer, the total financial value of the movement, and the specific GL accounts debited and credited - not just a bin-to-bin transfer log.
One data layer, 4 reporting perspectives - no version conflicts
CFOs need financial valuations tied to GL accounts. Controllers need period-close reconciliation reports. Supply chain VPs need location-level stock maps. Warehouse managers need scan logs and count accuracy. Naologic serves all four from the same data - no duplication, no conflicting figures, no "whose number is right?" debate at month-end.

CFO: GL-mapped movement valuation

Controller: adjustment audit trail

Supply Chain VP: location hierarchy view

Warehouse Manager: barcode scan log
Inventory reporting technical documentation
How GL Attribution Works Across Inventory Movements
A technical walkthrough of how Naologic maps item-level GL accounts to every receipt, transfer, and fulfillment event - with no manual reclassification at period close.
Movement History: Data Fields and Financial Structure
Field-by-field documentation of the Movement History ledger including operation types, unit cost calculations, and GL account mapping logic per event type.
Building Inventory Reports in Plain English With the AI Report Builder
Step-by-step instructions for querying inventory, scrap, and stock data using natural language and pinning results to permanent, auto-updating dashboards.
